

New
Insights gives organization Owners a single dashboard for how the whole org is using Playlab: which apps are in use, how many members are active, how many sessions ran, who needs a closer look, and which spaces and apps are getting traction. Pick a date range at the top and every number on the page updates to match.
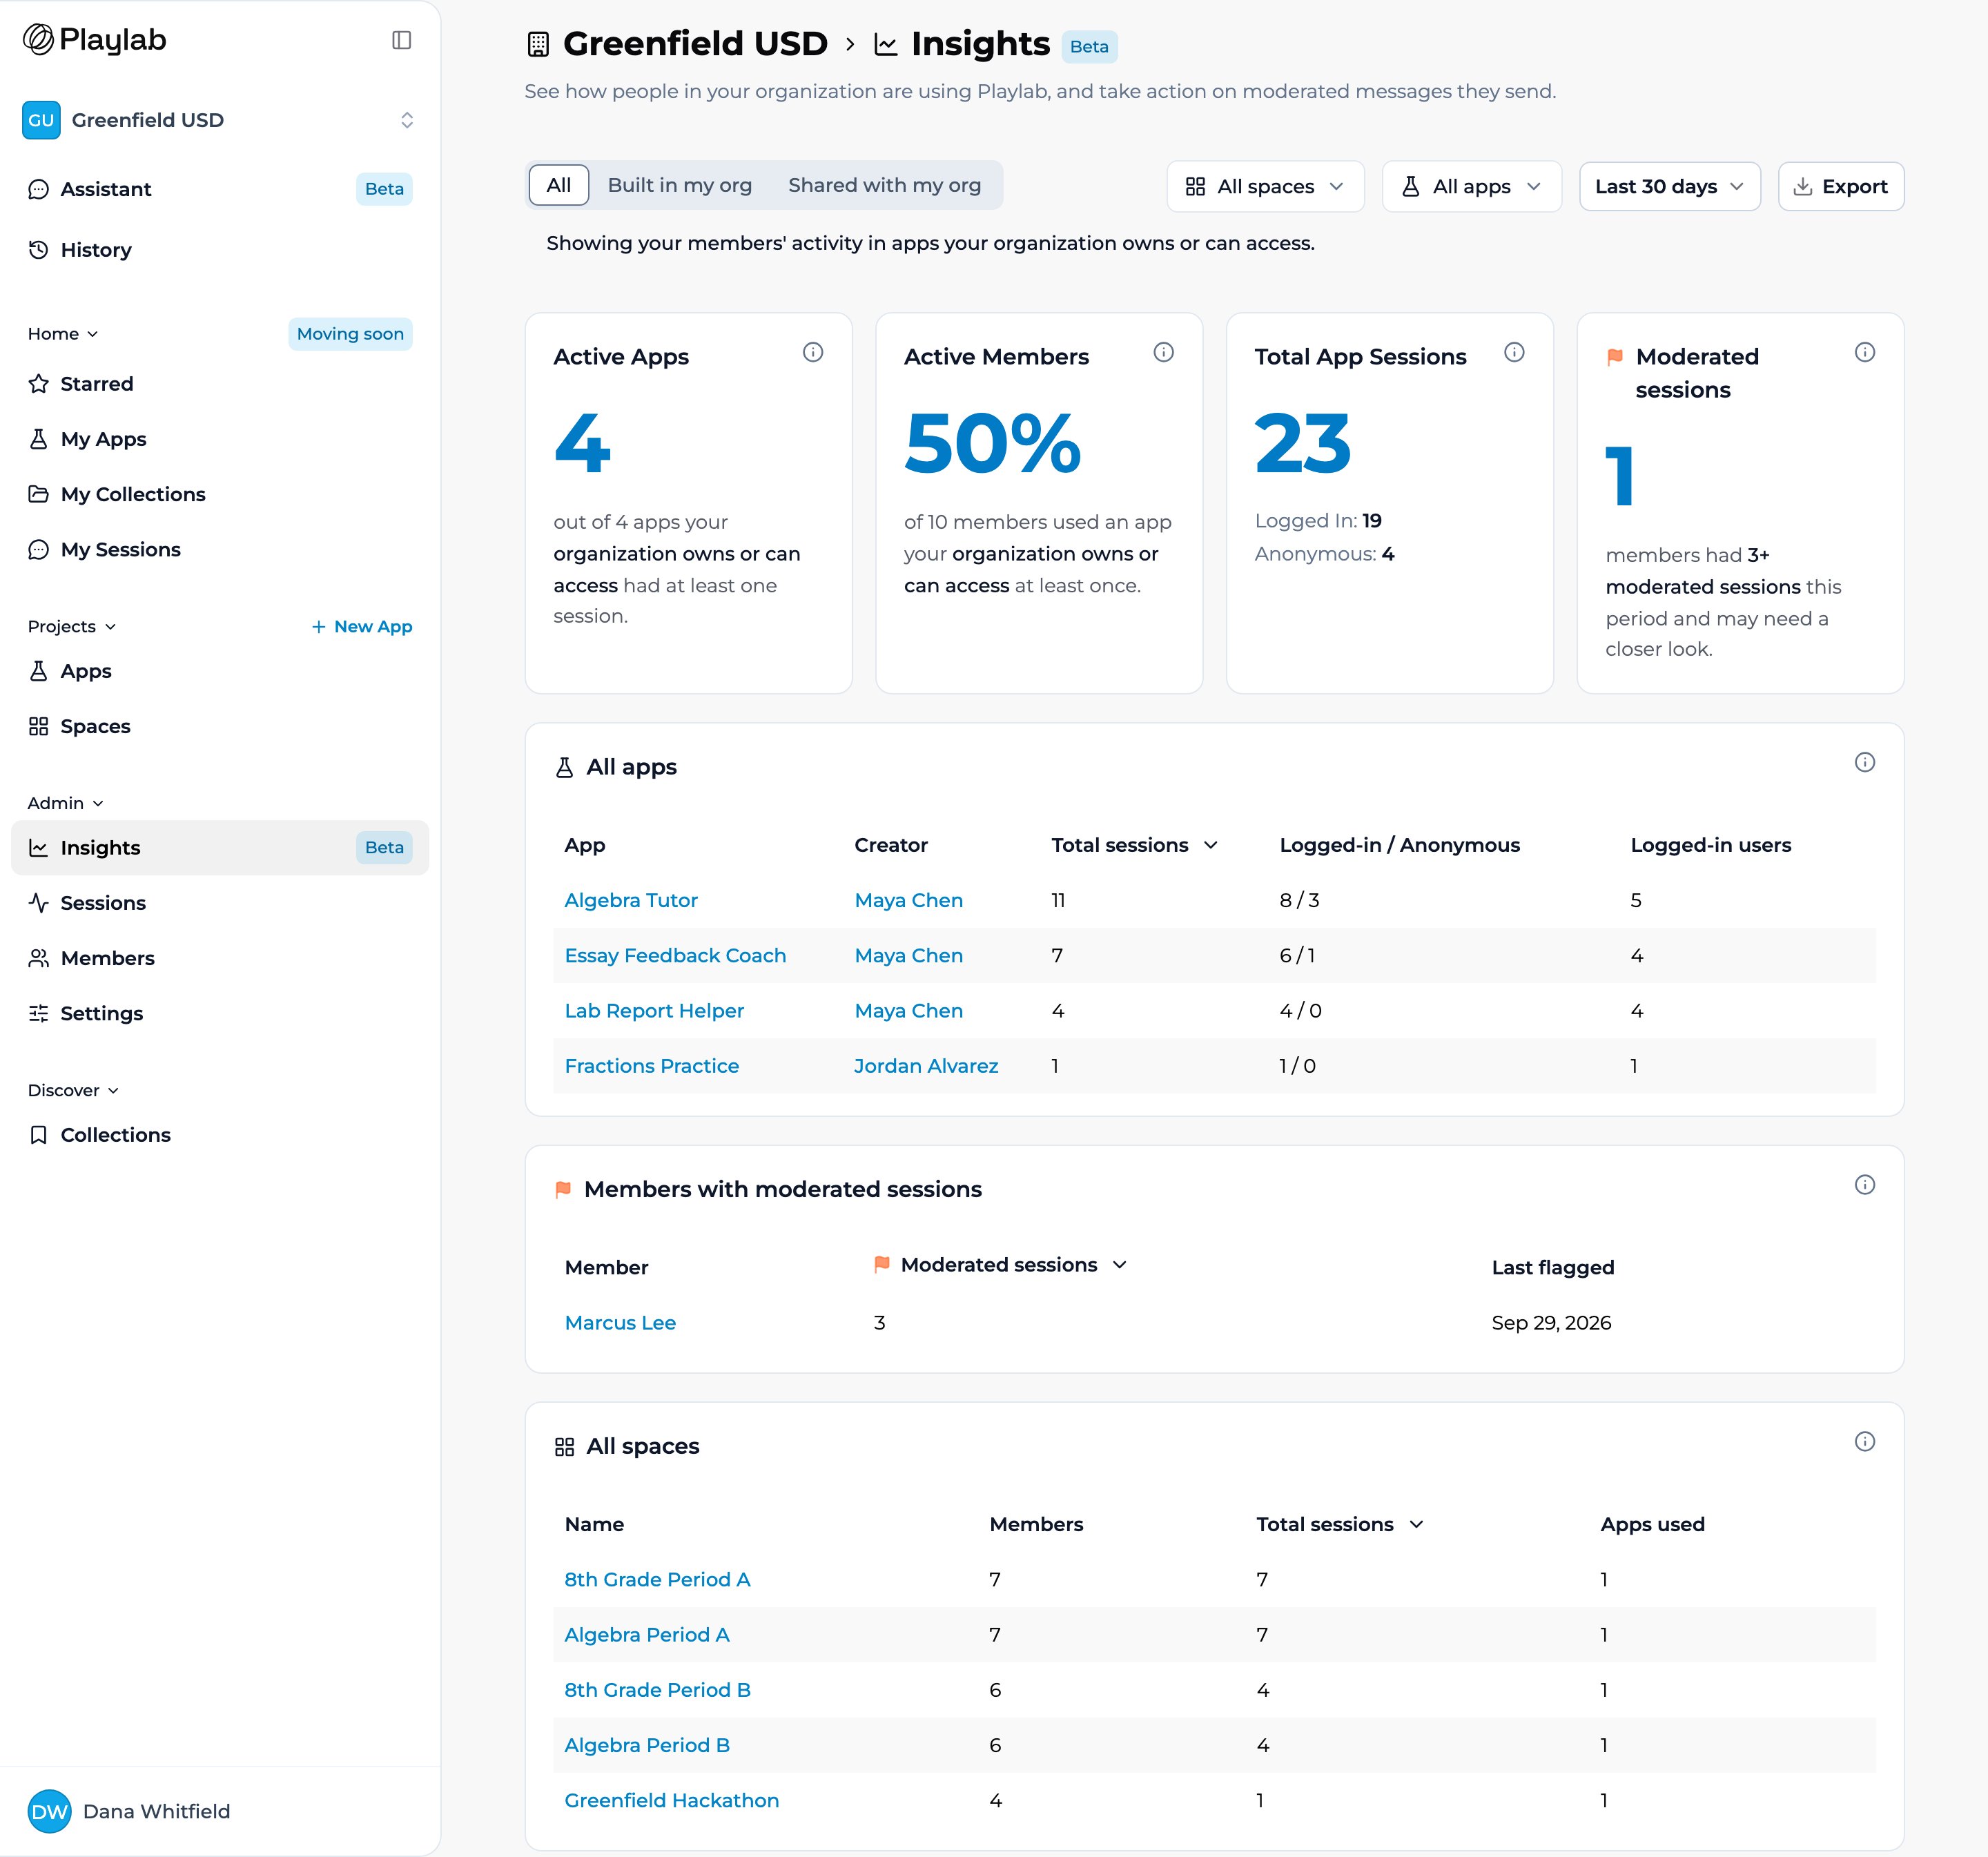
The Organization Insights page, opened from Admin in the sidebar. Filter by space or app, pick a date range, and every card and table below reflects your choices.
Who can see it
The full organization view — including Export and the moderation tables — is for organization Owners. Builders and Editors also see Insights under Admin, in a narrower version limited to the spaces they manage or the apps they built, without Export. Users and Space-only members don’t have access.How to open it
1
Open Insights
In the left sidebar, under Admin, select Insights. Make sure the organization switcher at the top of the sidebar shows the right organization.
2
Choose a date range
Use the date dropdown (top right) to pick Last 7 days, Last 30 days, or Last 90 days. The default is Last 30 days.
3
Narrow it down (optional)
Use the Spaces and Apps filters, next to the date dropdown, to focus on particular classes or apps. Owners also have an App ownership control on the left.
4
Read the dashboard
Start with the cards for the headline numbers, then use the tables to see where the activity is coming from.
Date range and filters
The date dropdown sets the window for the whole page. The Spaces and Apps filters narrow every card and table to what you pick. Your choices are kept in the page URL, so you can bookmark or share a view. For Owners, App ownership sets whose apps count: All (the default) covers your organization’s apps plus apps shared with it, Built in my org covers only apps your organization owns, and Shared with my org covers only apps shared in from outside.What the dashboard shows
Cards
- Active Apps — how many of your organization’s apps had at least one session in the range, out of all the apps created in your organization. Counts published-app sessions only.
- Active Members — the share of your organization’s members who used an app at least once in the range.
- Total App Sessions — every session in the range, split into Logged In and Anonymous.
- Moderated sessions — how many members had 3 or more moderated sessions in the range and may need a closer look.
All apps
One row per app: App, Creator, Total sessions, Logged-in / Anonymous, and Logged-in users. Apps shared with your organization but owned elsewhere are marked External. Sort by any column to see which apps are driving usage and who built them.Members with moderated sessions
One row per member who had a moderated session in the range: Member, Moderated sessions, and Last flagged. Click a member to open their member page. Unless App ownership is set to Built in my org, it also counts flags your members picked up on apps shared with your organization.All spaces
One row per space with at least one session in the range: Name, Members, Total sessions, and Apps used. Archived spaces aren’t included. Sort by any column to find your most (or least) active classes.Playlab started tracking activity by space on June 13, 2026, so the All spaces numbers don’t include anything before then.
All users
One row per person: User, Total sessions, Last activity, Flagged sessions, and Last flagged.Exporting the data
The Export button (top right) downloads the page as a ZIP of CSVs for the date range and filters you’re viewing. See Exporting activity data to CSV for what’s in the export and how to use it.Insights for builders
Builders and Editors open Insights under Admin in the sidebar and see the apps they built. It’s the same page, narrowed: the Active Apps, Total App Sessions, and Moderated sessions cards, plus the All apps and All users tables, with the date range and the Apps filter. There’s no Active Members card, Spaces filter, or Export. For class-level detail, use the Sessions tab in each space. See Reviewing session activity.Key points
- Insights (under Admin in the sidebar) is an org-wide dashboard for organization Owners
- A date range (Last 7, 30, or 90 days) and optional Spaces / Apps filters drive every number on the page
- Cards cover Active Apps, Active Members, Total App Sessions, and Moderated sessions
- Tables show all apps, members with moderated sessions, all spaces, and all users
- Export downloads it all as CSVs — see Exporting activity data
- Builders and Editors see their own apps in the same Insights page
FAQ
Who can see Organization Insights?
Who can see Organization Insights?
Organization Owners see the full organization. Builders and Editors see a version limited to the spaces they manage or the apps they built, without Export. Users and Space-only members don’t have access.
Does changing the date range change everything on the page?
Does changing the date range change everything on the page?
Yes. Every card and table reflects the selected range and any Spaces or Apps filters, so the numbers describe a single period.
Can I export what I see?
Can I export what I see?
Yes, if you’re an organization Owner. The Export button (top right) downloads a ZIP of CSVs matching the page, date range, and filters. See Exporting activity data to CSV.
Where do builders see app-level insights?
Where do builders see app-level insights?
In Insights, under Admin in the sidebar. Builders and Editors see the apps they built. For class-level detail, use each space’s Sessions tab.
Last updated: 10-02-2026 Contact us at [email protected]