

New
The Organization Insights page has a page-level Export button that downloads your org’s usage data as a ZIP of CSV files. The export mirrors what you see on the page for the date range and filters you’ve selected, so the numbers in the CSVs match the numbers on screen.
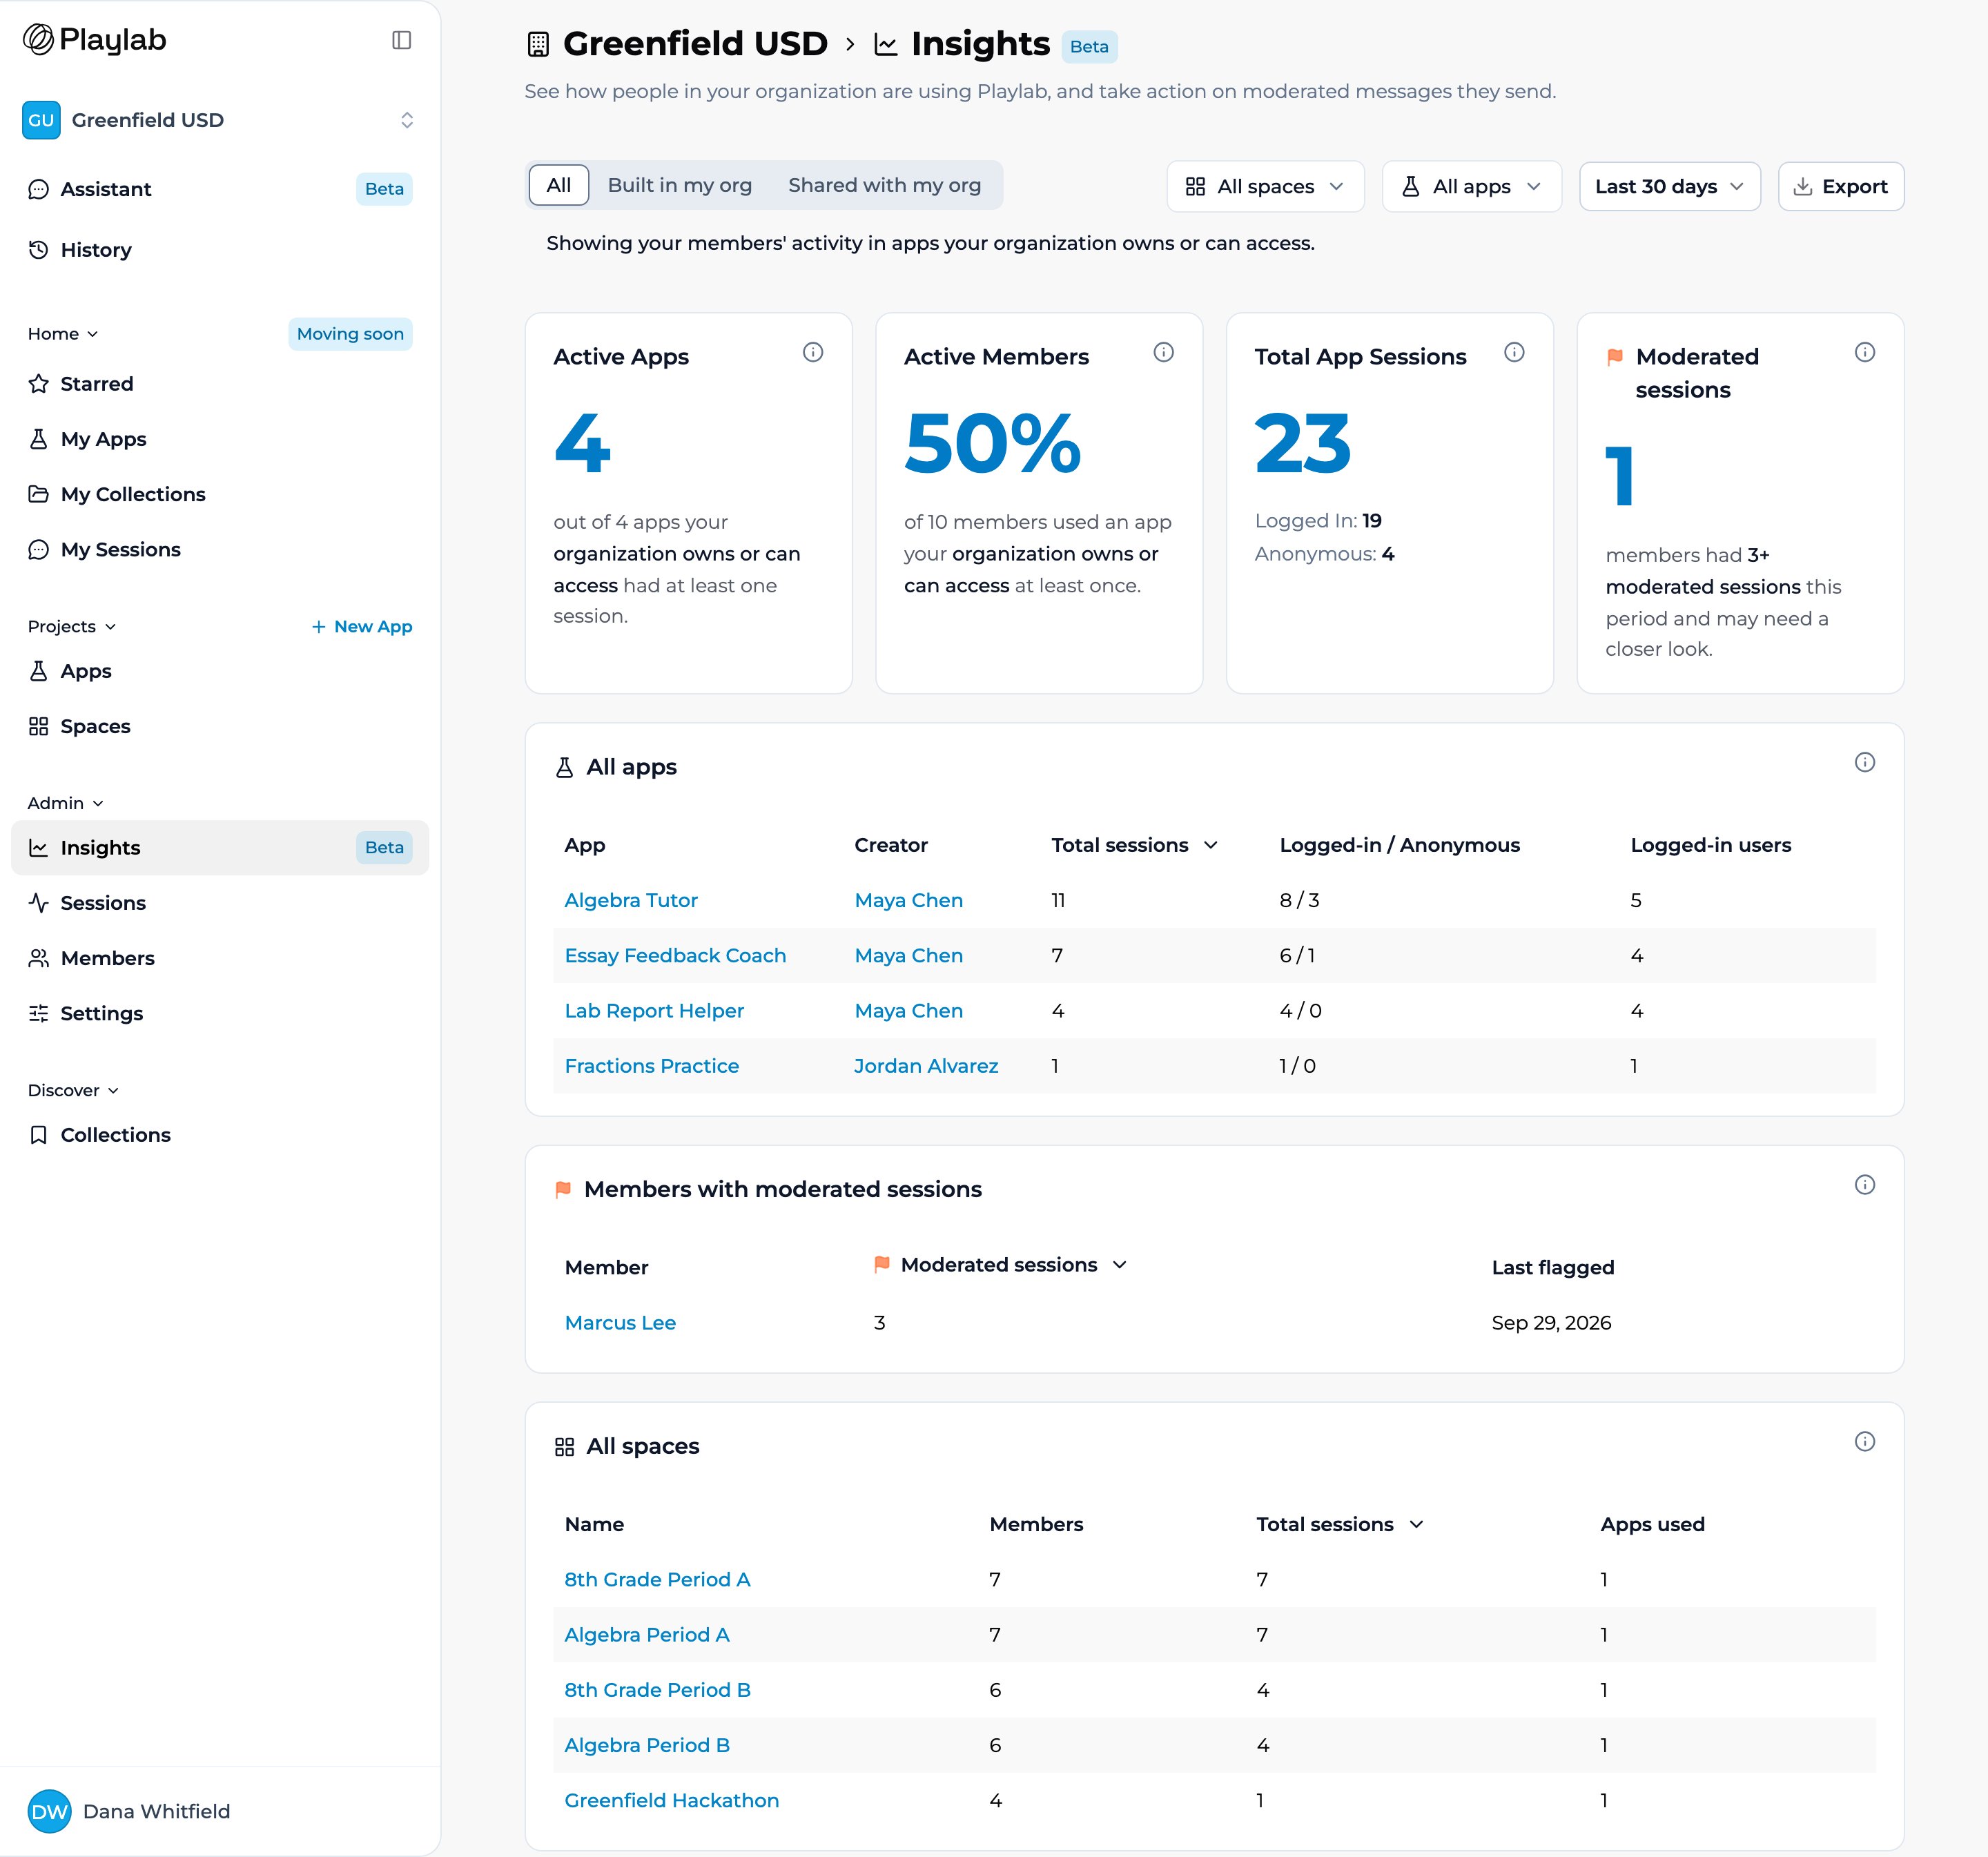
The Organization Insights page. Pick a date range and any filters, then click Export (top right) to download the data as CSVs.
Who can export
Only organization Owners can export. Builders and Editors who can open a limited version of Insights don’t get the Export button. For class-level data, space managers use the space’s Sessions tab instead — see Reviewing Session Activity.Each export is recorded, and every Owner in the organization gets an email when someone exports Insights data.
How to export
1
Open Organization Insights
In the left sidebar, under Admin, select Insights.
2
Choose a date range
Use the date dropdown to pick Last 7 days, Last 30 days, or Last 90 days, and optionally narrow with the Spaces and Apps filters and the App ownership control. Everything in the export reflects these choices.
3
Click Export
Select Export in the top right. Playlab opens a new tab to prepare the file — keep it open until the ZIP downloads, which can take a minute.
4
Open the CSVs
Unzip the file to find five CSVs. Open any of them in a spreadsheet app such as Numbers, Excel, or Google Sheets.
What’s in the ZIP
The download is a single ZIP named for your org and date range — for example,acme-org-organization-insights-2026-04-26-to-2026-05-25.zip. Because the dates are baked into the filename, re-running the export for a different range gives you a new file instead of overwriting the last one.
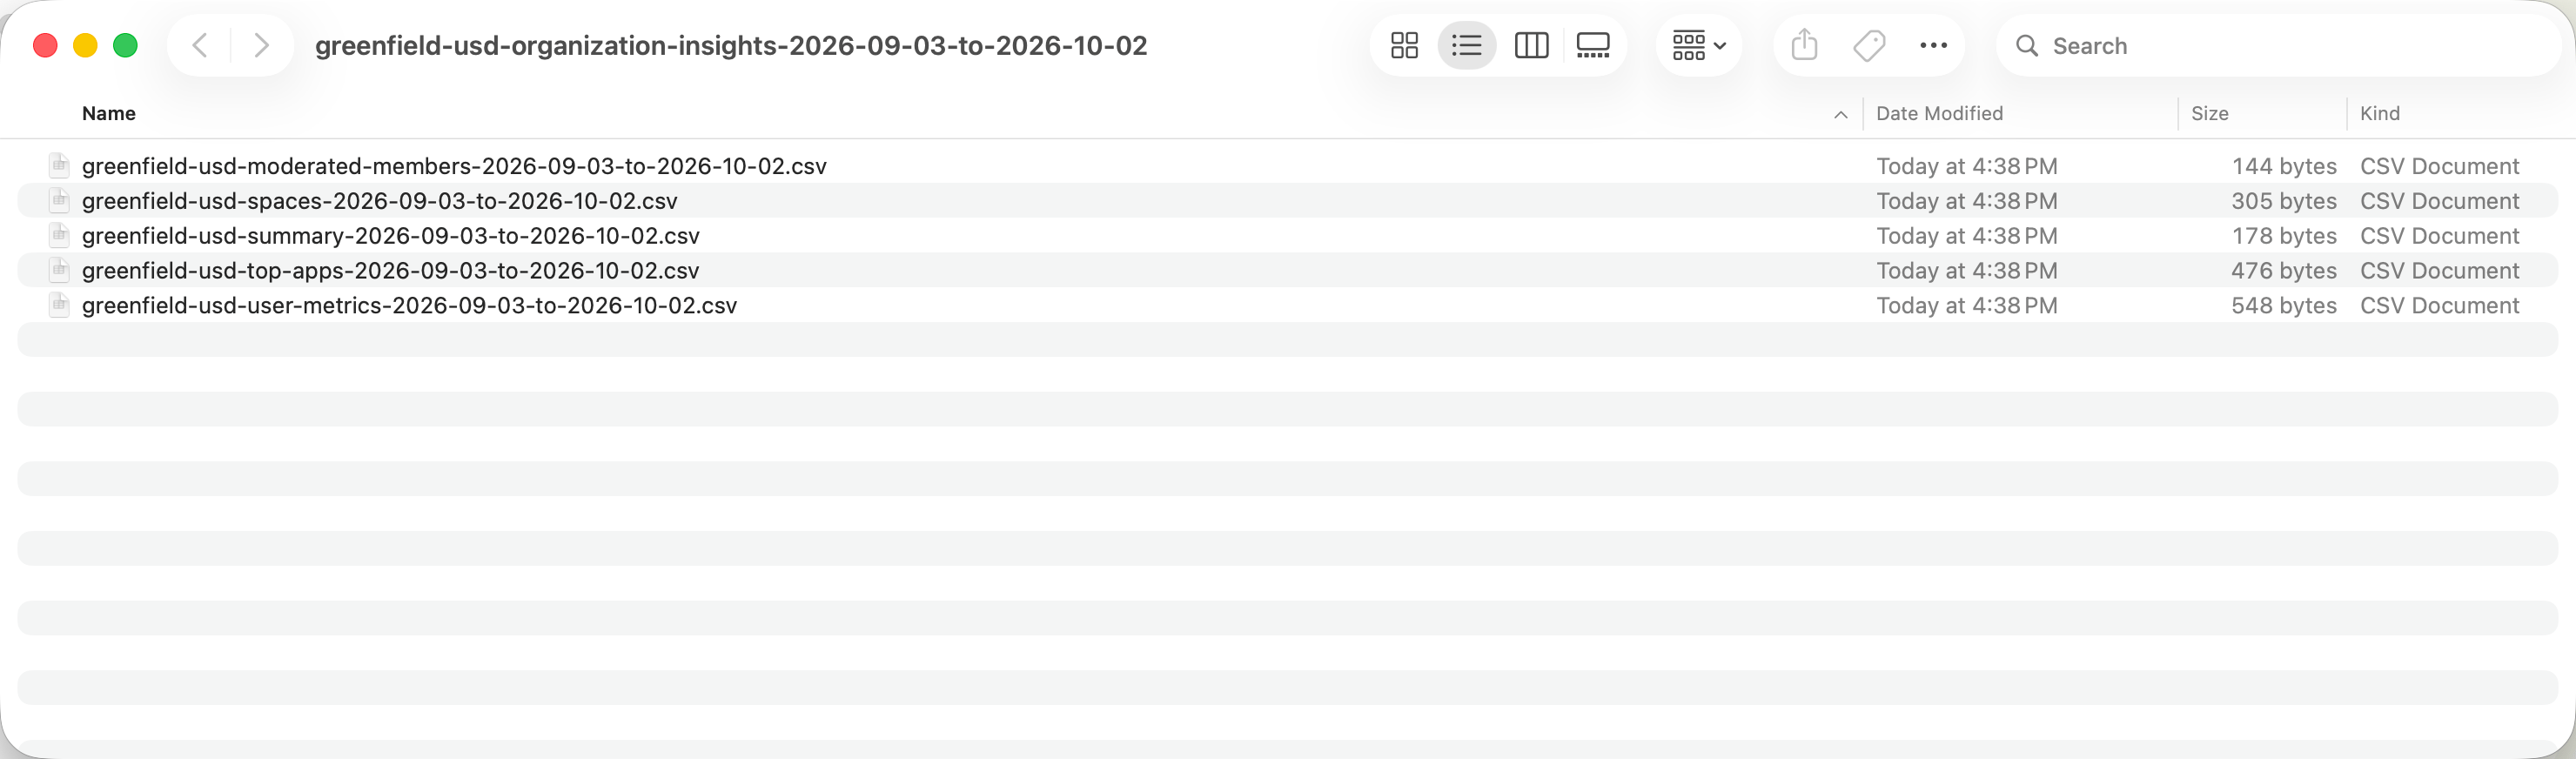
The unzipped export: each CSV is stamped with the same date range as the ZIP.
summary.csv
A simple Metric / Value table of the org-wide numbers from the summary cards: the App ownership setting, apps used, total apps, active members, total members, active-member percentage, logged-in and anonymous sessions, and the count of members with three or more flags.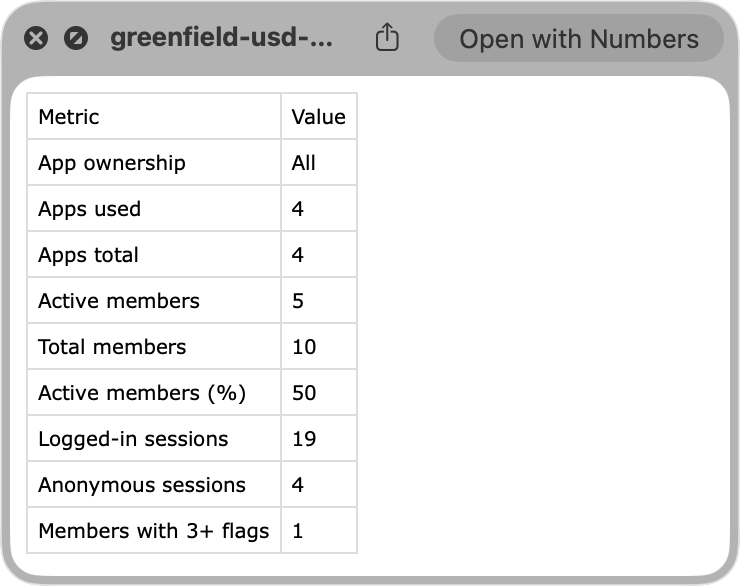
summary.csv: the org-wide headline numbers as Metric and Value pairs.
spaces.csv
One row per space, with Space ID, Space Name, Members, Total Sessions, and Apps Used — the data behind the All spaces table on the page.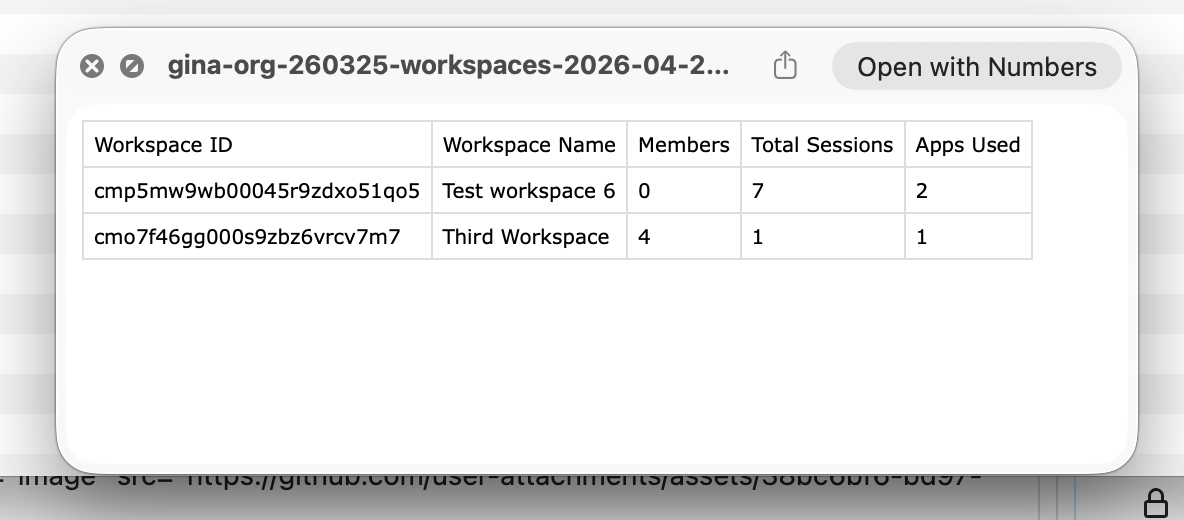
spaces.csv: one row per space with members, total sessions, and apps used.
top-apps.csv
One row per app, with App ID, App Name, External (marked for apps shared in from outside), Creator ID, Creator Name, Total Sessions, Logged-in Sessions, Anonymous Sessions, and Active Users — the data behind the All apps table, including the IDs and creator details that the on-screen table abbreviates.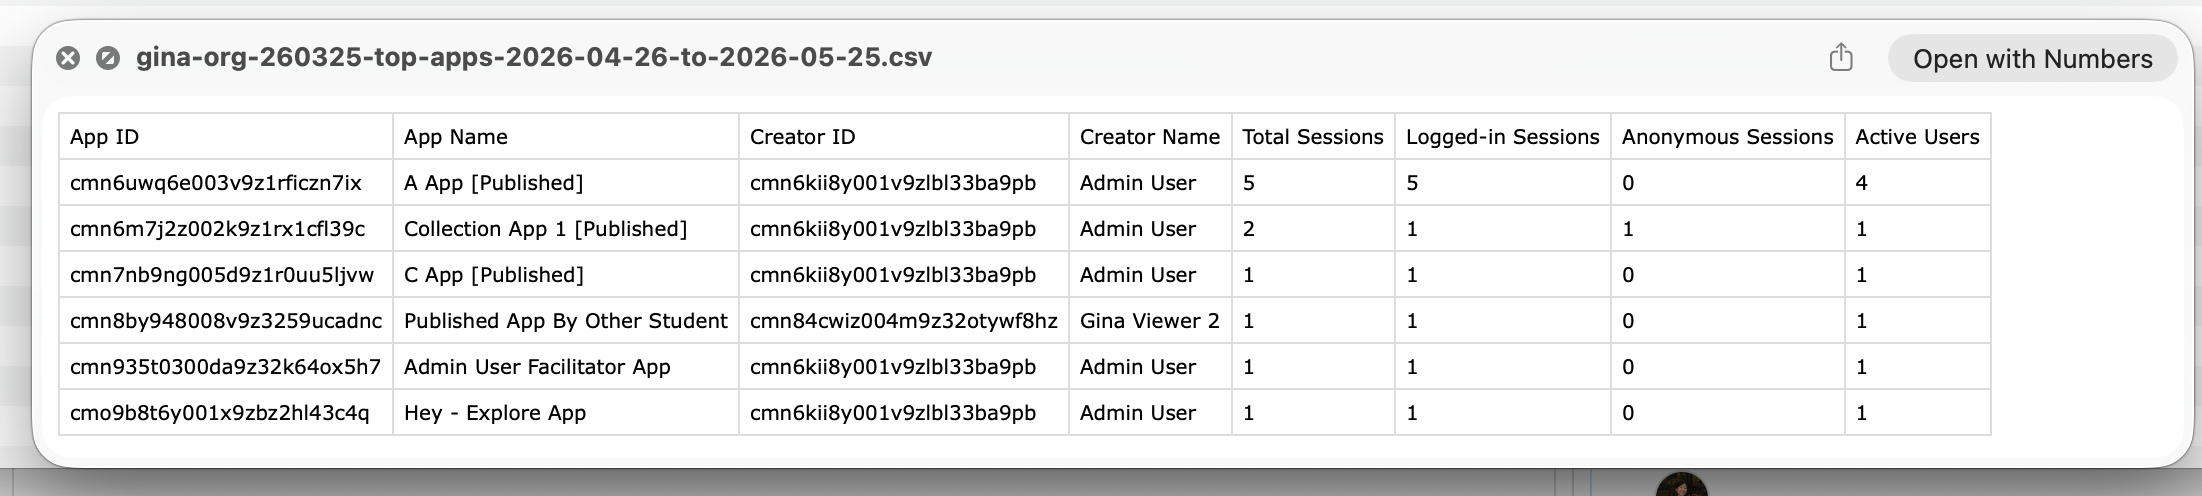
top-apps.csv: one row per app with creator, session counts, and active users.
moderated-members.csv
One row per member with a moderated session, with User ID, User Name, User Email, Moderated Sessions, and Last Flagged — the data behind the Members with moderated sessions table.user-metrics.csv
One row per person, with User ID, User Name, User Email, Sessions, Last Activity, Flagged Sessions, and Last Flagged — the data behind the All users table.Each table file (spaces, top apps, moderated members, and user metrics) is capped at 5,000 rows. If a file hits the cap, its first line says how many rows were left out. Narrow the date range or filters to see everything.
Key points
- One Export button on the Organization Insights page downloads a ZIP of CSVs
- The export reflects the date range (Last 7, 30, or 90 days), any Spaces / Apps filters, and App ownership
- The ZIP contains five files: summary, spaces, top apps, moderated members, and user metrics
- Available to organization Owners only; other Owners are emailed when someone exports
FAQ
Does the export match what I see on the page?
Does the export match what I see on the page?
Yes. The CSVs are generated from the same data, date range, and filters as the page, so the summary numbers line up with the cards and each table file matches its table on the page.
What format is the export?
What format is the export?
A ZIP file containing five CSVs (summary, spaces, top apps, moderated members, user metrics). CSV opens in any spreadsheet app — Numbers, Excel, or Google Sheets.
Can I change the date range?
Can I change the date range?
Yes. Pick Last 7, 30, or 90 days from the date dropdown before clicking Export. The dates are written into the filenames, so exports for different ranges don’t collide.
Is there a row limit?
Is there a row limit?
Each table file is capped at 5,000 rows, and a truncated file says so on its first line. If your org is larger, export a narrower date range or use the filters.
How is this different from the space activity export?
How is this different from the space activity export?
This is the org-wide Insights export (CSVs). A space’s Sessions tab exports full session transcripts as JSON for that one space — see Reviewing Session Activity. Use Insights for org-wide trends and the space export for detailed session review.
Last updated: 10-02-2026 Contact us at [email protected]