> ## Documentation Index
> Fetch the complete documentation index at: https://learn.playlab.ai/llms.txt
> Use this file to discover all available pages before exploring further.
# Exporting activity data
> How to get your Playlab usage data out — workspace activity as JSON, and organization-wide Insights as CSVs.
Playlab gives you two ways to take your usage data with you, depending on what you're looking at and your role. Pick the one that matches your scope:
* **One workspace, conversation detail →** export the [Activity view](/getstarted/Reviewing%20Activity) as JSON.
* **Whole org, usage trends →** export the Insights page as CSVs.
## Exporting one workspace (JSON)
Inside any workspace, the **Activity** view lists every app session. From the **⋮** overflow menu, choose **Export activity data (JSON)** to download the currently filtered activity. Any Apps, Users, or Date Range filters you've set carry into the export, so you can scope the file to exactly what you're reviewing.
For the full walkthrough of filtering and reading activity, see [Reviewing Activity](/getstarted/Reviewing%20Activity).
## Exporting the whole organization (CSV)
If you're an **organization Owner**, the **Insights** page gives you an org-wide picture — apps used, active members, sessions, your most active workspaces, and your top apps. The **Export** button (top right) downloads all of it as CSVs for the date range you've selected.
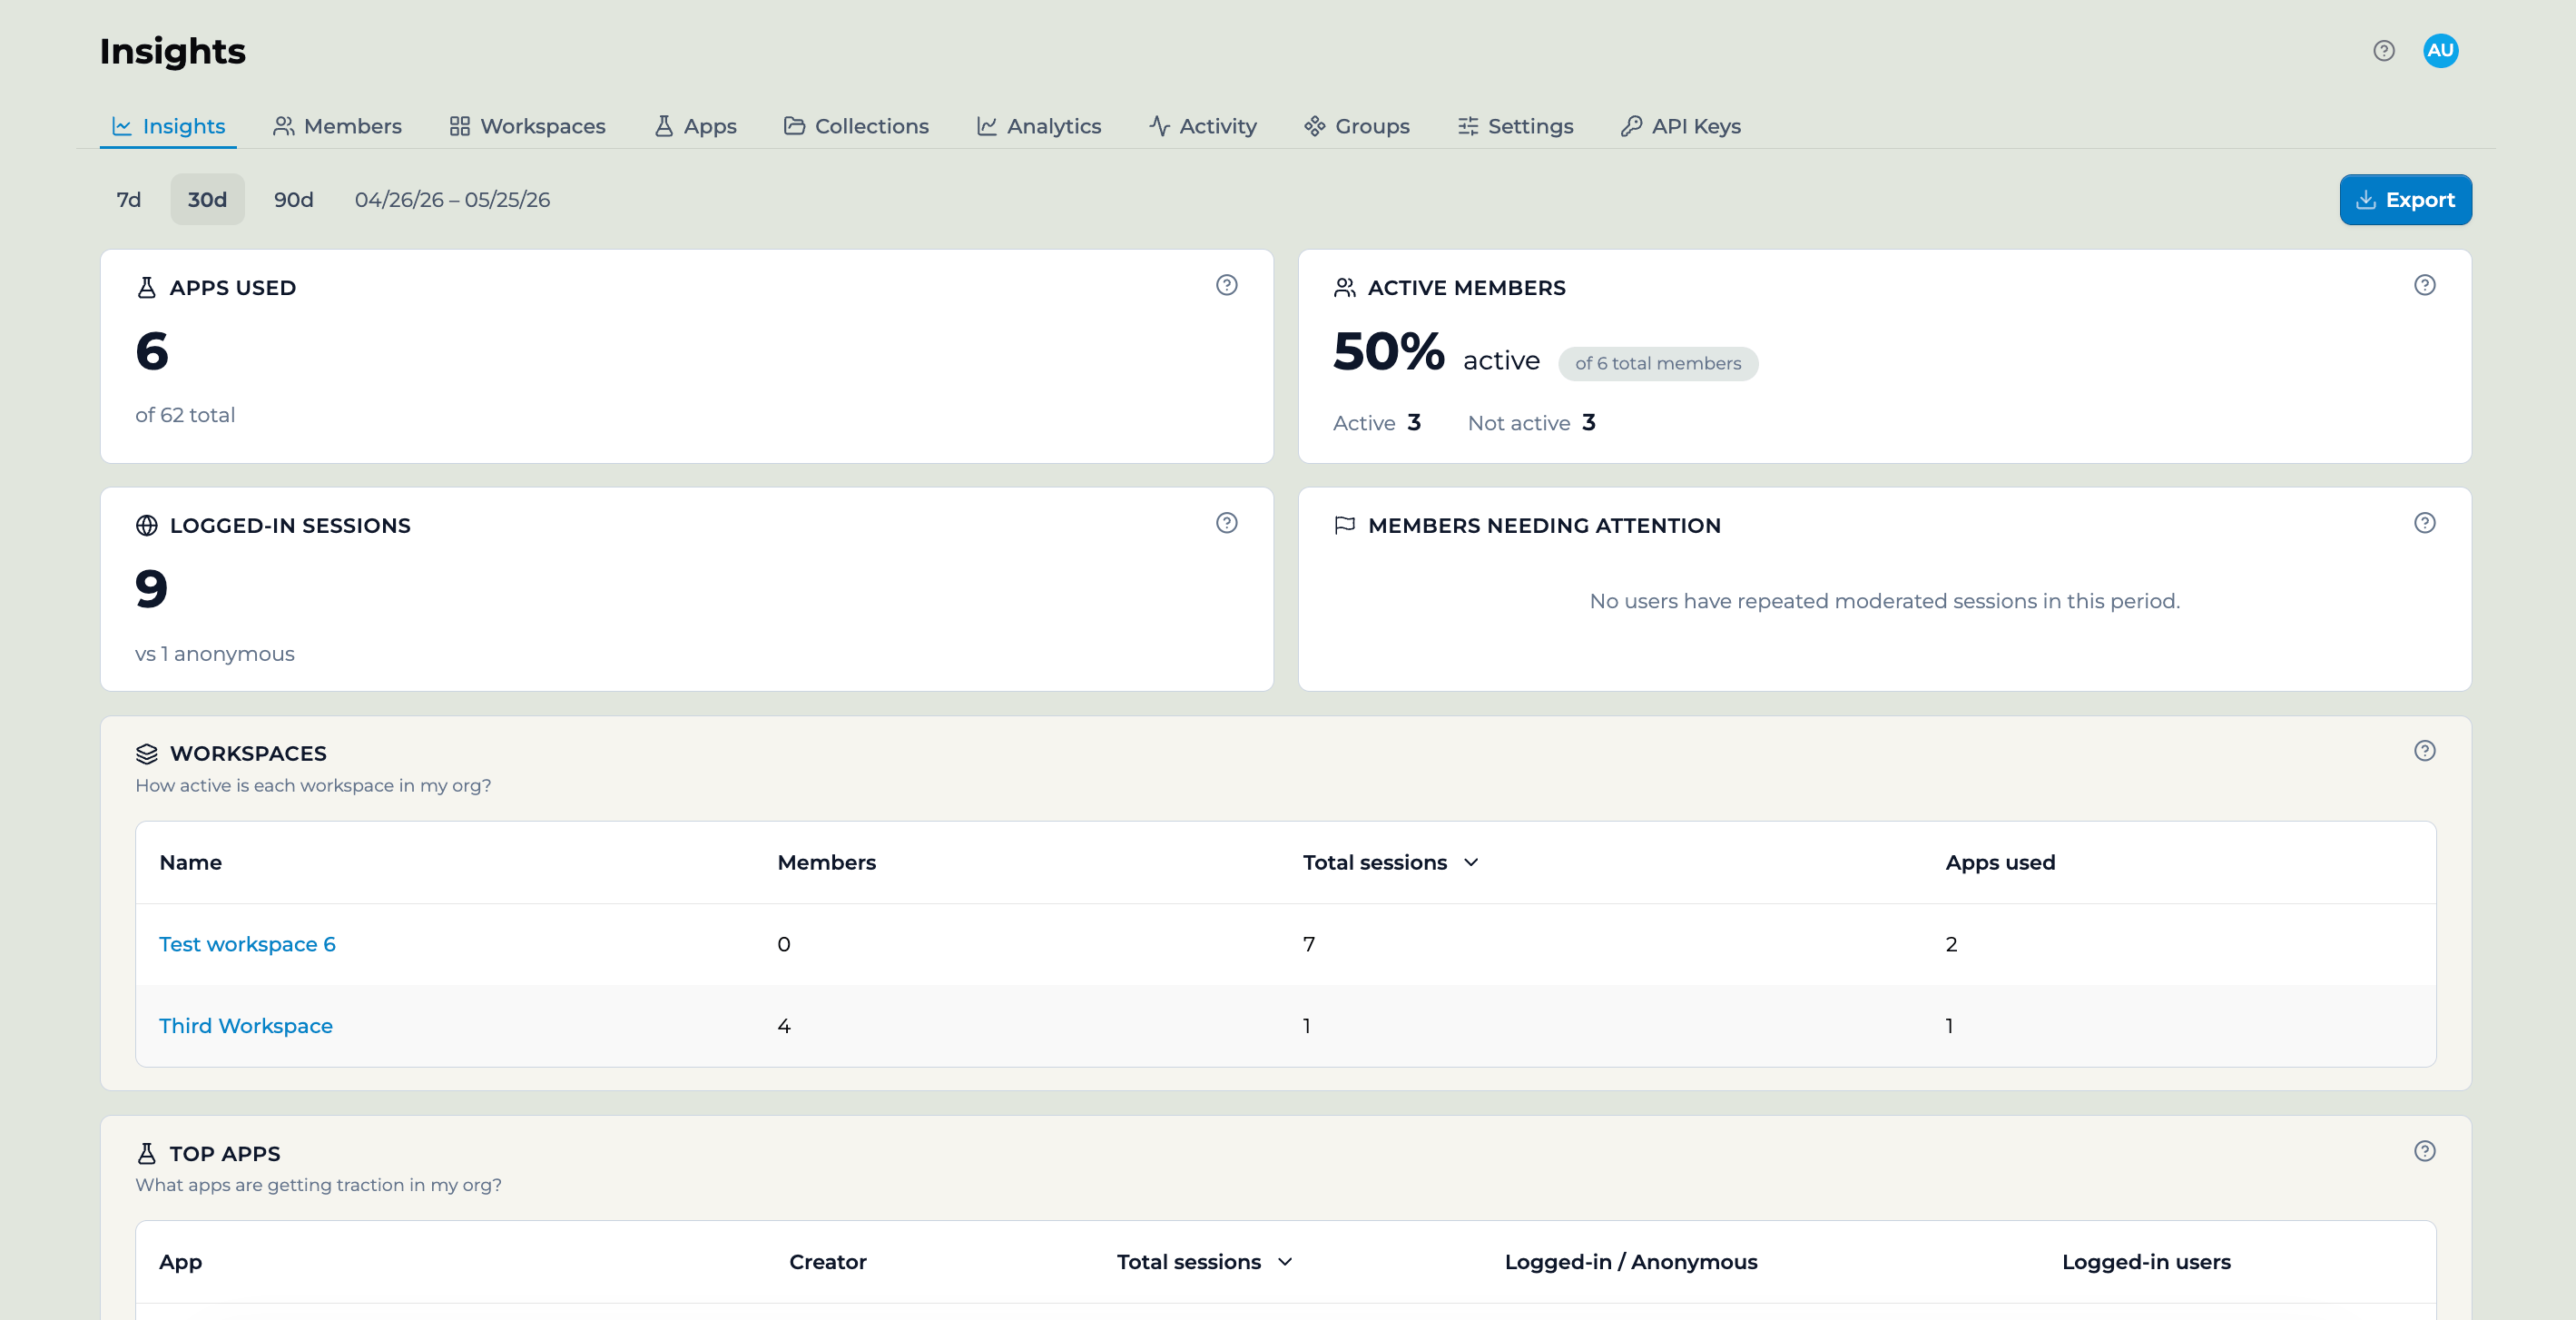 Go to your organization and open the **Insights** tab.
Use the **7d**, **30d**, or **90d** chips, or set a custom range. The export reflects this range.
Select **Export** in the top right to download a ZIP file.
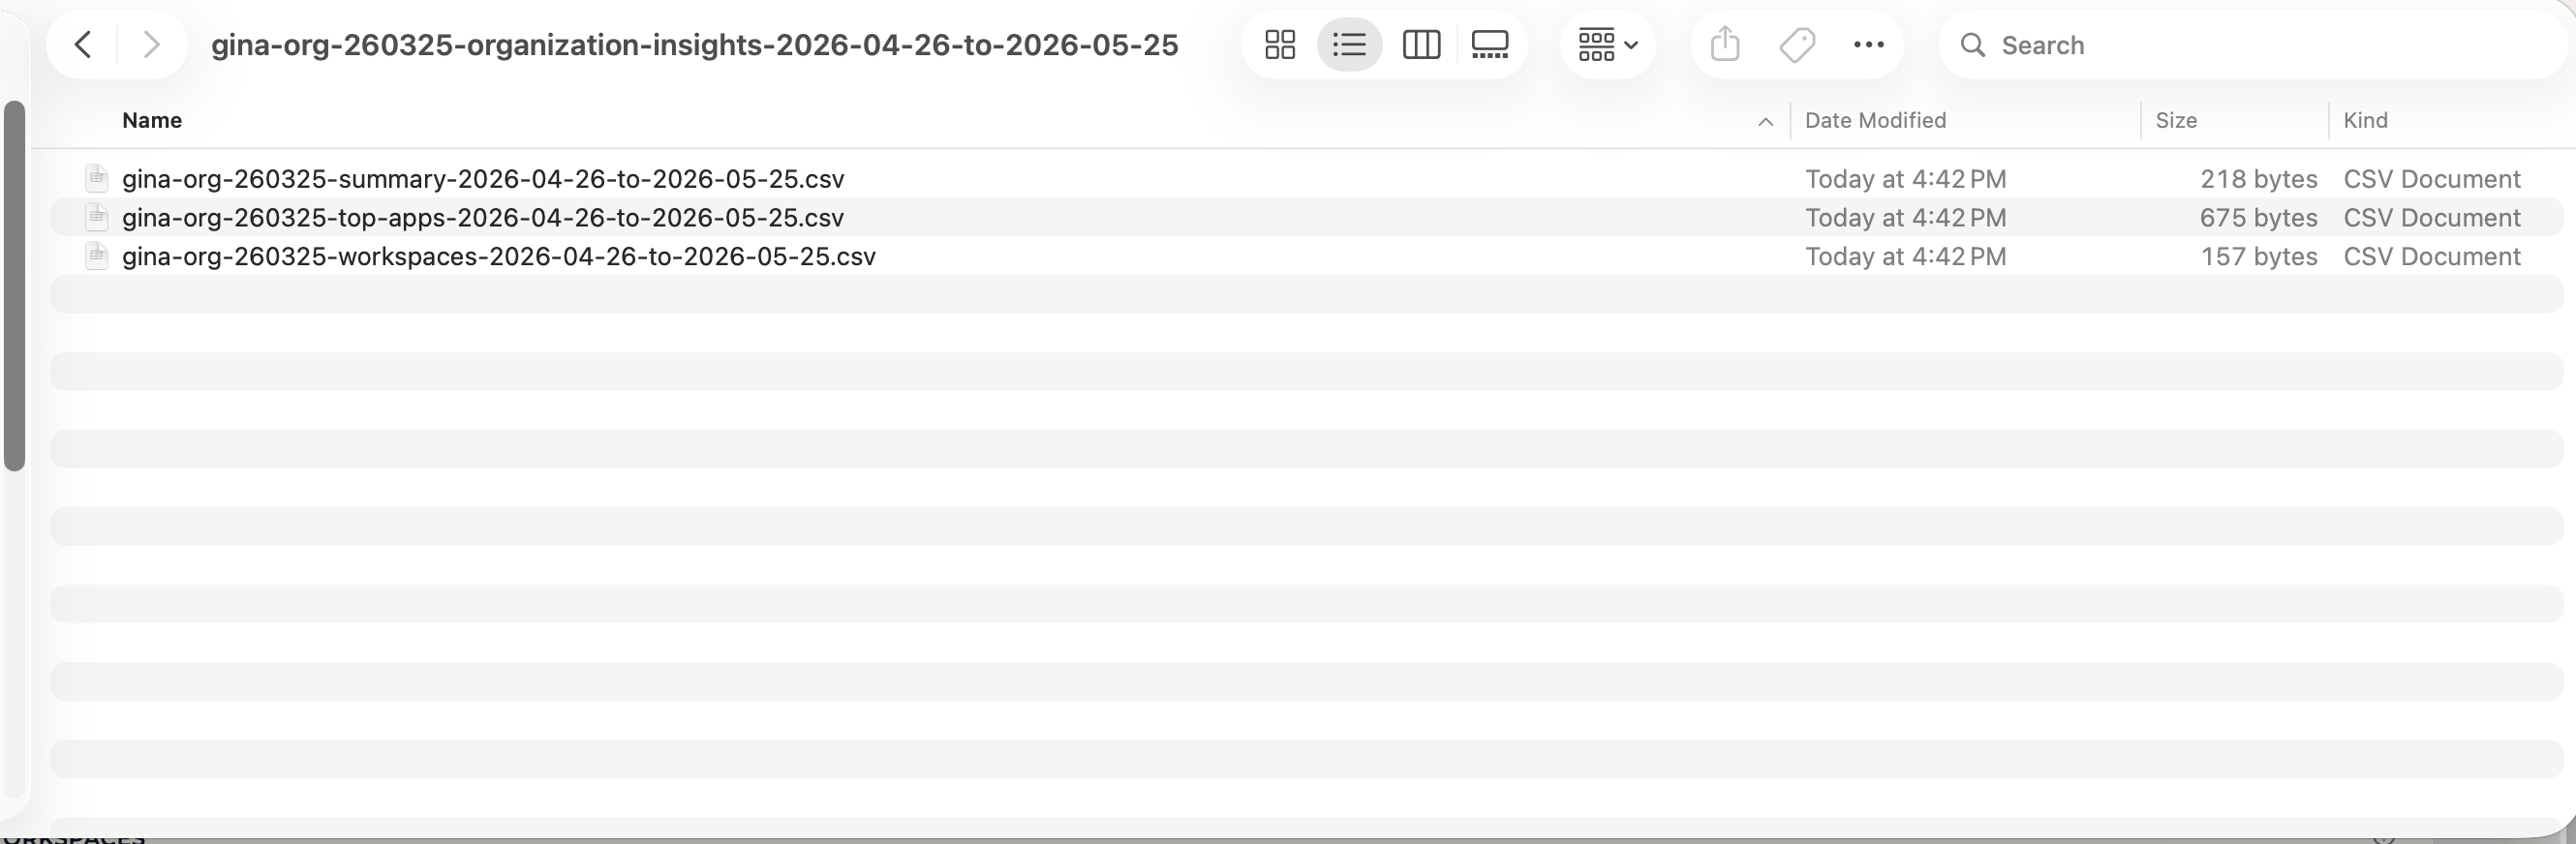
The ZIP unzips to three CSVs — a **summary** of the headline numbers, a **workspaces** breakdown, and your **top apps** — each named with the date range so repeat exports don't overwrite each other.
Go to your organization and open the **Insights** tab.
Use the **7d**, **30d**, or **90d** chips, or set a custom range. The export reflects this range.
Select **Export** in the top right to download a ZIP file.
The ZIP unzips to three CSVs — a **summary** of the headline numbers, a **workspaces** breakdown, and your **top apps** — each named with the date range so repeat exports don't overwrite each other.
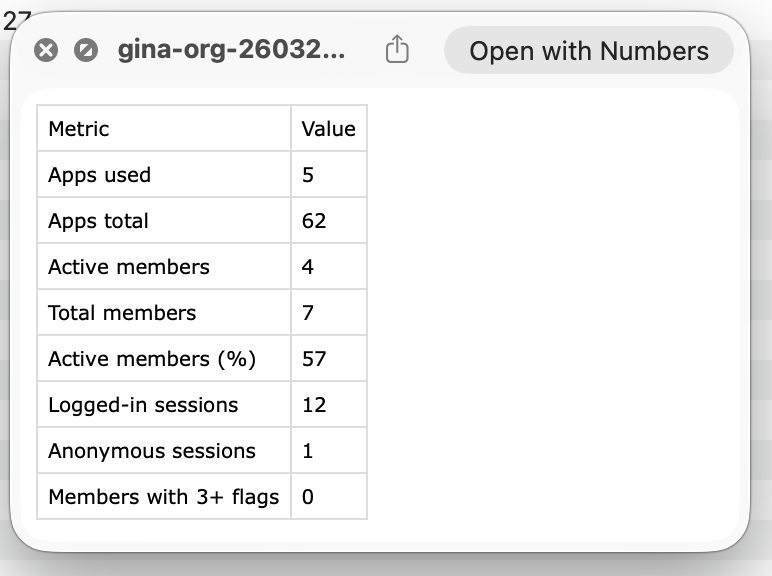
 Open any of them in a spreadsheet app. The summary file, for instance, lays the org-wide numbers out as simple Metric / Value pairs:
 For the full breakdown of every file and column, see [Exporting activity data to CSV](/features/Exporting%20Activity%20Data).
## Key points
* **Workspace owners and facilitators** export a single workspace's activity as **JSON** from the Activity view
* **Organization Owners** export org-wide Insights as a ZIP of **CSVs** from the Insights page
* Both exports honor whatever **filters and date range** you have applied
## FAQ
Use the workspace Activity export (JSON) when you want detailed, conversation-level data for one class or workspace. Use the org Insights export (CSV) when you want org-wide usage trends across every workspace and app.
Yes. The workspace export honors the Apps, Users, and Date Range filters on the Activity view. The Insights export reflects the date range selected on the Insights page.
Organization Owners with access to the Insights page. Everyone else exports their own workspace's activity instead.
Workspace activity exports as a JSON file. Org Insights exports as a ZIP of CSV files that open in any spreadsheet app.
***
Last updated: 06-26-2026
Contact us at [support@playlab.ai](mailto:support@playlab.ai)
For the full breakdown of every file and column, see [Exporting activity data to CSV](/features/Exporting%20Activity%20Data).
## Key points
* **Workspace owners and facilitators** export a single workspace's activity as **JSON** from the Activity view
* **Organization Owners** export org-wide Insights as a ZIP of **CSVs** from the Insights page
* Both exports honor whatever **filters and date range** you have applied
## FAQ
Use the workspace Activity export (JSON) when you want detailed, conversation-level data for one class or workspace. Use the org Insights export (CSV) when you want org-wide usage trends across every workspace and app.
Yes. The workspace export honors the Apps, Users, and Date Range filters on the Activity view. The Insights export reflects the date range selected on the Insights page.
Organization Owners with access to the Insights page. Everyone else exports their own workspace's activity instead.
Workspace activity exports as a JSON file. Org Insights exports as a ZIP of CSV files that open in any spreadsheet app.
***
Last updated: 06-26-2026
Contact us at [support@playlab.ai](mailto:support@playlab.ai)