> ## Documentation Index
> Fetch the complete documentation index at: https://learn.playlab.ai/llms.txt
> Use this file to discover all available pages before exploring further.
# Organization-level insights
> An org-wide dashboard for organization Owners: apps used, active members, sessions, members needing attention, plus per-workspace and top-app breakdowns.
New
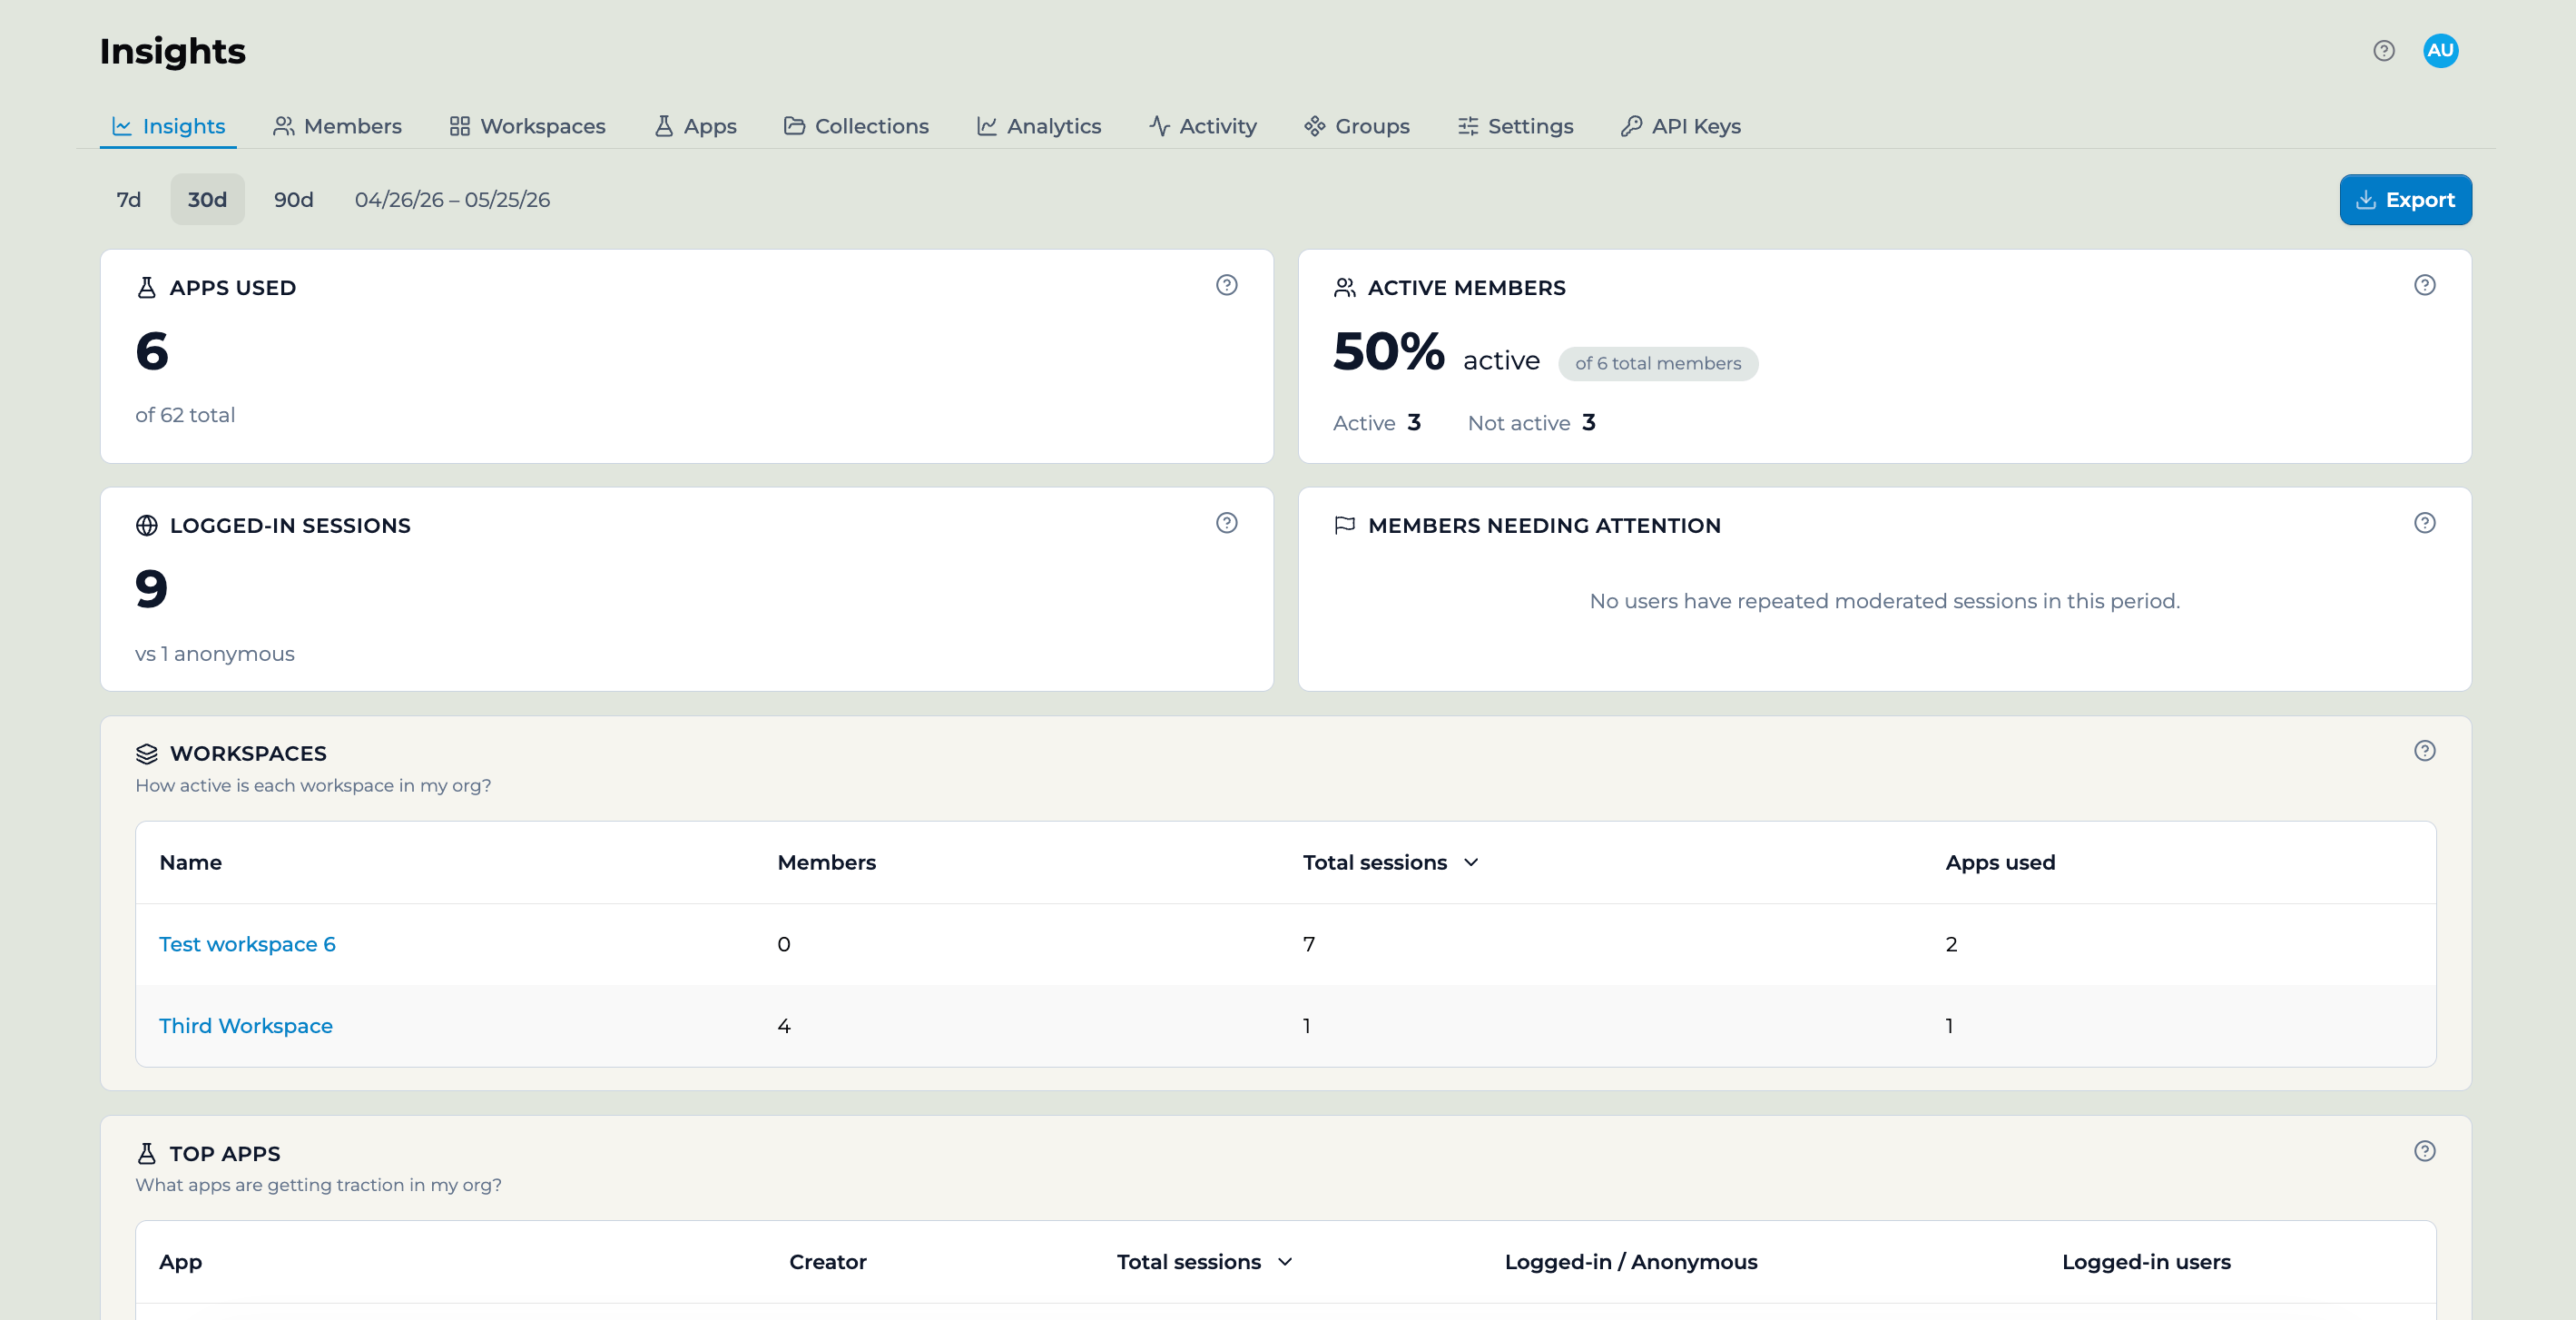
The **Insights** tab gives organization Owners a single dashboard for how the whole org is using Playlab: how many apps are in use, how many members are active, how many sessions ran, and which workspaces and apps are getting traction. Pick a date range at the top and every number on the page updates to match.
 ## Who can see it
The Insights tab is available to **organization Owners**. Everyone else in a workspace uses the [workspace Activity view](/getstarted/Reviewing%20Activity) for their own scope. For drilling into a single app across the org, admins use [centralized org monitoring](/features/Reviewing%20App%20Activity).
## Choosing a date range
The chips at the top — **7d**, **30d**, **90d**, or a **custom range** — set the window for the whole page. Everything below (the summary cards, the Workspaces table, and the Top apps table) reflects the range you select, so the numbers always describe the same period.
## What the dashboard shows
### Summary cards
Four cards give you the org-wide headline numbers for the selected range:
* **Apps used** — how many of your org's apps saw activity in the range, out of the total number of apps your org has built.
* **Active members** — the share of members who used Playlab in the range, with the active and not-active counts behind the percentage.
* **Logged-in sessions** — total signed-in sessions, shown alongside the anonymous session count for comparison.
* **Members needing attention** — surfaces members with repeated moderated sessions in the range, so you can follow up. When there are none, the card says so.
### Workspaces
A **How active is each workspace in my org?** table with one row per workspace: **Name**, **Members**, **Total sessions**, and **Apps used**. Sort by any column to see your most (or least) active workspaces.
### Top apps
A **What apps are getting traction in my org?** table with one row per app: **App**, **Creator**, **Total sessions**, **Logged-in / Anonymous**, and **Logged-in users** — so you can see which apps are driving usage and who built them.
## How to open it
Open your organization and select the **Insights** tab.
Use the **7d**, **30d**, or **90d** chips, or set a custom range.
Review the summary cards for the headline numbers, then use the Workspaces and Top apps tables to see where the activity is coming from.
## Exporting the data
The page-level **Export** button (top right) downloads everything on the page as a ZIP of CSVs for the date range you're viewing. See [Exporting activity data to CSV](/features/Exporting%20Activity%20Data) for what's in the export and how to use it.
## App-level insights for builders
Builders have their own **app-level** view — total users, sessions, average conversation length, and engagement over time for the apps you own. An **Active Apps** widget highlights which of your apps are getting used, so you can see what's live at a glance. It uses the same **date-range** controls as this page (**7d**, **30d**, **90d**, or a **custom range**), so you can scope any app's numbers to the window you care about.
For the class and org scopes, two related views cover the rest:
* **Workspace activity.** The Activity view in each workspace shows sessions and conversations for apps used there. See [Reviewing student activity per class](/getstarted/Reviewing%20Activity).
* **Org-level monitoring.** Org admins have a cross-workspace view that filters by app. See [Centralized org monitoring](/features/Reviewing%20App%20Activity).
## Key points
* The **Insights** tab is an org-wide dashboard for **organization Owners**
* A **date range** (7d / 30d / 90d / custom) drives every number on the page
* Summary cards cover apps used, active members, sessions, and members needing attention
* **Workspaces** and **Top apps** tables show where activity is concentrated
* The page-level **Export** downloads it all as CSVs — see [Exporting activity data](/features/Exporting%20Activity%20Data)
* Builders get a per-app view of the apps they own, with the same date-range controls
## FAQ
Organization Owners. Everyone else in a workspace uses the workspace Activity view for their own scope.
Yes. The summary cards, Workspaces table, and Top apps table all reflect the selected range, so the numbers describe a single period.
Yes. The Export button (top right) downloads a ZIP of CSVs matching the page and date range. See [Exporting activity data to CSV](/features/Exporting%20Activity%20Data).
Builders have a per-app view for the apps they own, with the same date-range controls as the org page. For class- and org-wide scopes, use the workspace Activity view or, for admins, centralized org monitoring.
***
Last updated: 06-26-2026
Contact us at [support@playlab.ai](mailto:support@playlab.ai)
## Who can see it
The Insights tab is available to **organization Owners**. Everyone else in a workspace uses the [workspace Activity view](/getstarted/Reviewing%20Activity) for their own scope. For drilling into a single app across the org, admins use [centralized org monitoring](/features/Reviewing%20App%20Activity).
## Choosing a date range
The chips at the top — **7d**, **30d**, **90d**, or a **custom range** — set the window for the whole page. Everything below (the summary cards, the Workspaces table, and the Top apps table) reflects the range you select, so the numbers always describe the same period.
## What the dashboard shows
### Summary cards
Four cards give you the org-wide headline numbers for the selected range:
* **Apps used** — how many of your org's apps saw activity in the range, out of the total number of apps your org has built.
* **Active members** — the share of members who used Playlab in the range, with the active and not-active counts behind the percentage.
* **Logged-in sessions** — total signed-in sessions, shown alongside the anonymous session count for comparison.
* **Members needing attention** — surfaces members with repeated moderated sessions in the range, so you can follow up. When there are none, the card says so.
### Workspaces
A **How active is each workspace in my org?** table with one row per workspace: **Name**, **Members**, **Total sessions**, and **Apps used**. Sort by any column to see your most (or least) active workspaces.
### Top apps
A **What apps are getting traction in my org?** table with one row per app: **App**, **Creator**, **Total sessions**, **Logged-in / Anonymous**, and **Logged-in users** — so you can see which apps are driving usage and who built them.
## How to open it
Open your organization and select the **Insights** tab.
Use the **7d**, **30d**, or **90d** chips, or set a custom range.
Review the summary cards for the headline numbers, then use the Workspaces and Top apps tables to see where the activity is coming from.
## Exporting the data
The page-level **Export** button (top right) downloads everything on the page as a ZIP of CSVs for the date range you're viewing. See [Exporting activity data to CSV](/features/Exporting%20Activity%20Data) for what's in the export and how to use it.
## App-level insights for builders
Builders have their own **app-level** view — total users, sessions, average conversation length, and engagement over time for the apps you own. An **Active Apps** widget highlights which of your apps are getting used, so you can see what's live at a glance. It uses the same **date-range** controls as this page (**7d**, **30d**, **90d**, or a **custom range**), so you can scope any app's numbers to the window you care about.
For the class and org scopes, two related views cover the rest:
* **Workspace activity.** The Activity view in each workspace shows sessions and conversations for apps used there. See [Reviewing student activity per class](/getstarted/Reviewing%20Activity).
* **Org-level monitoring.** Org admins have a cross-workspace view that filters by app. See [Centralized org monitoring](/features/Reviewing%20App%20Activity).
## Key points
* The **Insights** tab is an org-wide dashboard for **organization Owners**
* A **date range** (7d / 30d / 90d / custom) drives every number on the page
* Summary cards cover apps used, active members, sessions, and members needing attention
* **Workspaces** and **Top apps** tables show where activity is concentrated
* The page-level **Export** downloads it all as CSVs — see [Exporting activity data](/features/Exporting%20Activity%20Data)
* Builders get a per-app view of the apps they own, with the same date-range controls
## FAQ
Organization Owners. Everyone else in a workspace uses the workspace Activity view for their own scope.
Yes. The summary cards, Workspaces table, and Top apps table all reflect the selected range, so the numbers describe a single period.
Yes. The Export button (top right) downloads a ZIP of CSVs matching the page and date range. See [Exporting activity data to CSV](/features/Exporting%20Activity%20Data).
Builders have a per-app view for the apps they own, with the same date-range controls as the org page. For class- and org-wide scopes, use the workspace Activity view or, for admins, centralized org monitoring.
***
Last updated: 06-26-2026
Contact us at [support@playlab.ai](mailto:support@playlab.ai)