> ## Documentation Index
> Fetch the complete documentation index at: https://learn.playlab.ai/llms.txt
> Use this file to discover all available pages before exploring further.
# Exporting activity data
> Export your Organization Insights — usage summary, workspaces, and top apps — as a ZIP of CSVs for the date range you're viewing.
New
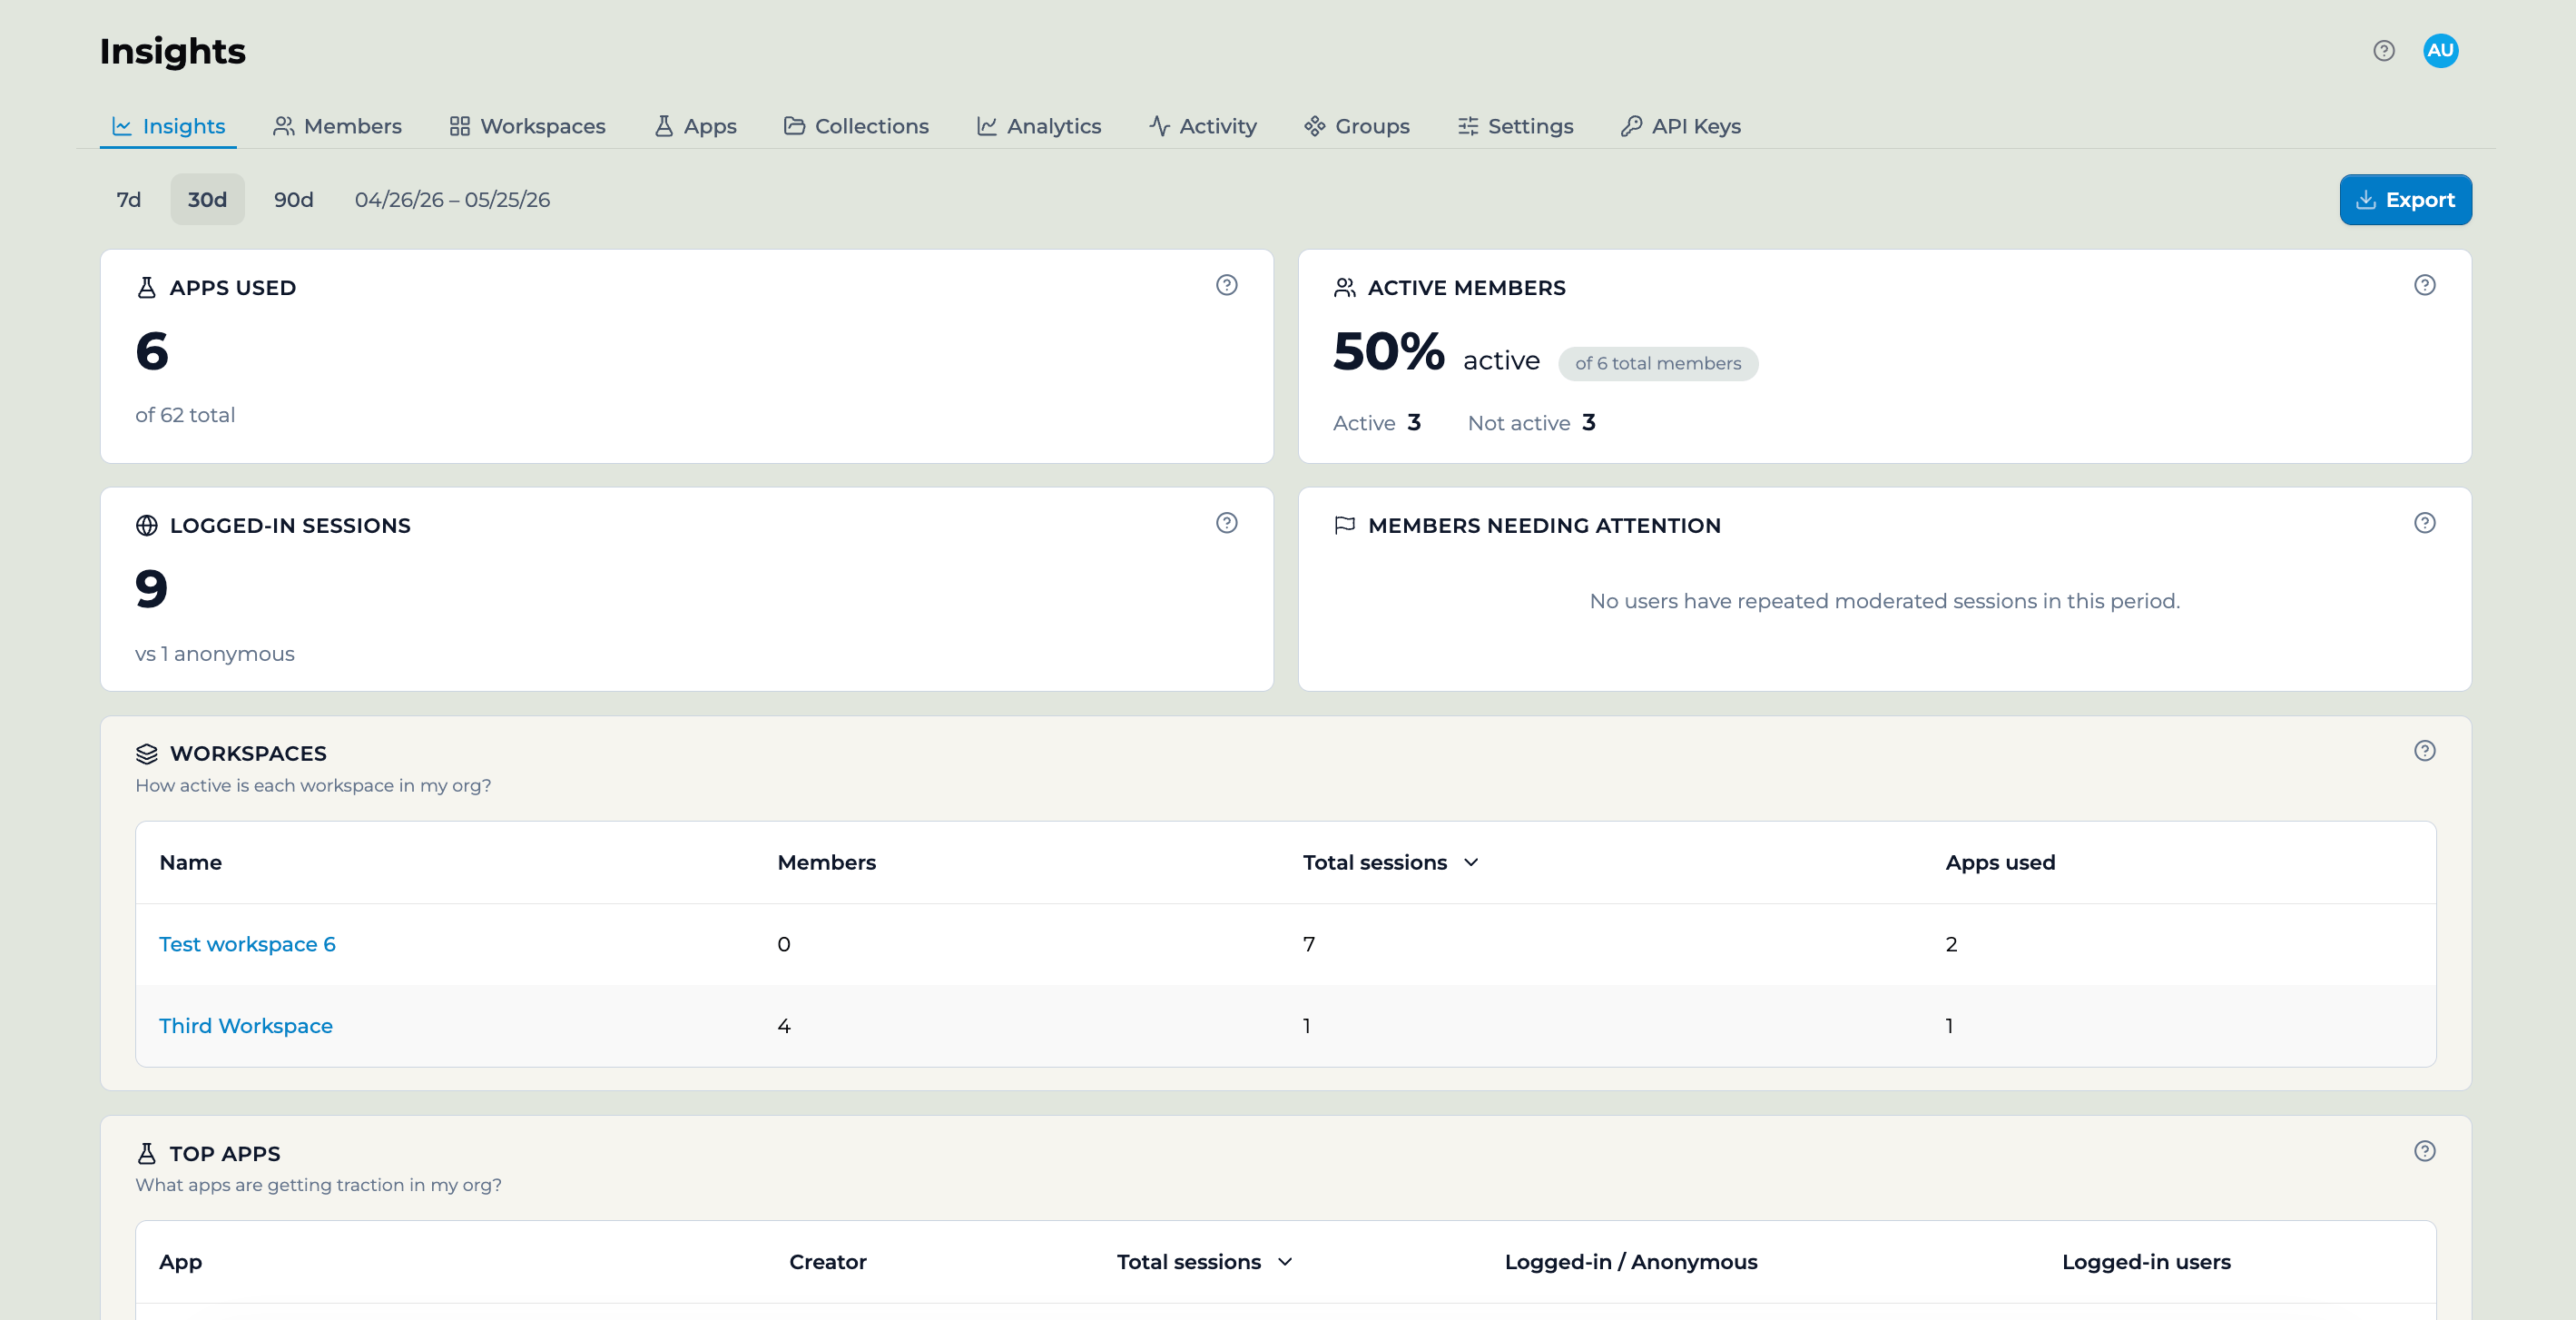
The Organization Insights page has a page-level **Export** button that downloads your org's usage data as a ZIP of CSV files. The export mirrors exactly what you see on the page for the date range you've selected, so the numbers in the CSVs match the numbers on screen.
 ## Who can export
The Export button is available to **organization Owners** who can view the Insights page. It uses the same access as the Insights page itself — if you can see Insights, you can export it. People in a workspace don't see the org-level Export; they use the [workspace Activity view](/getstarted/Reviewing%20Activity) for their own scope.
## How to export
Go to your organization and open the **Insights** tab.
Use the **7d**, **30d**, or **90d** chips at the top, or set a custom range. Everything in the export — the summary numbers, the workspaces, and the top apps — reflects this range.
Select **Export** in the top right. A ZIP file downloads to your computer.
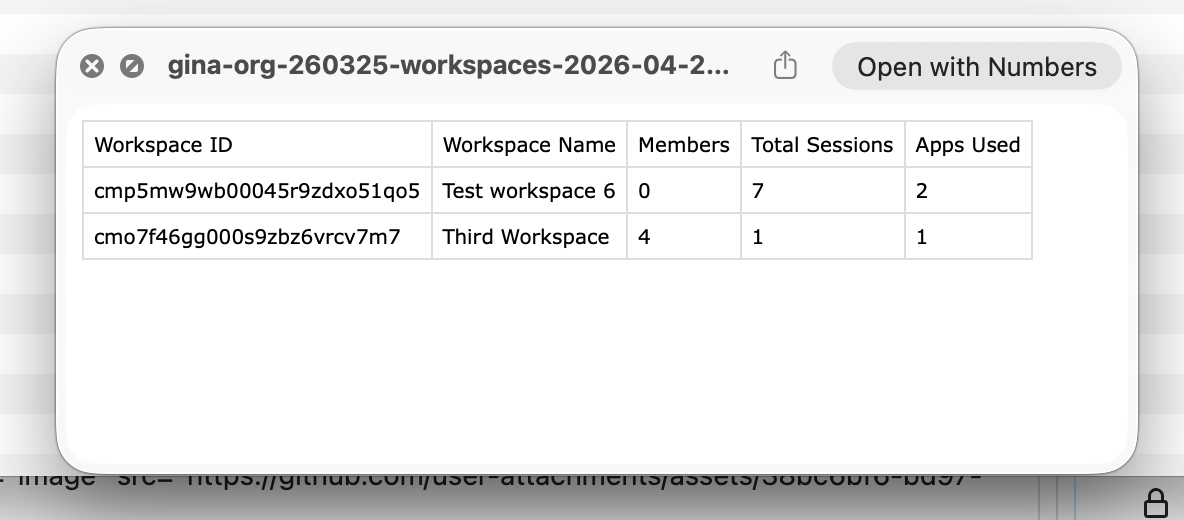
Unzip the file to find three CSVs. Open any of them in a spreadsheet app such as Numbers, Excel, or Google Sheets.
## What's in the ZIP
The download is a single ZIP named for your org and date range — for example, `acme-org-organization-insights-2026-04-26-to-2026-05-25.zip`. Because the dates are baked into the filename, re-running the export for a different range gives you a new file instead of overwriting the last one.
## Who can export
The Export button is available to **organization Owners** who can view the Insights page. It uses the same access as the Insights page itself — if you can see Insights, you can export it. People in a workspace don't see the org-level Export; they use the [workspace Activity view](/getstarted/Reviewing%20Activity) for their own scope.
## How to export
Go to your organization and open the **Insights** tab.
Use the **7d**, **30d**, or **90d** chips at the top, or set a custom range. Everything in the export — the summary numbers, the workspaces, and the top apps — reflects this range.
Select **Export** in the top right. A ZIP file downloads to your computer.
Unzip the file to find three CSVs. Open any of them in a spreadsheet app such as Numbers, Excel, or Google Sheets.
## What's in the ZIP
The download is a single ZIP named for your org and date range — for example, `acme-org-organization-insights-2026-04-26-to-2026-05-25.zip`. Because the dates are baked into the filename, re-running the export for a different range gives you a new file instead of overwriting the last one.
 ### summary.csv
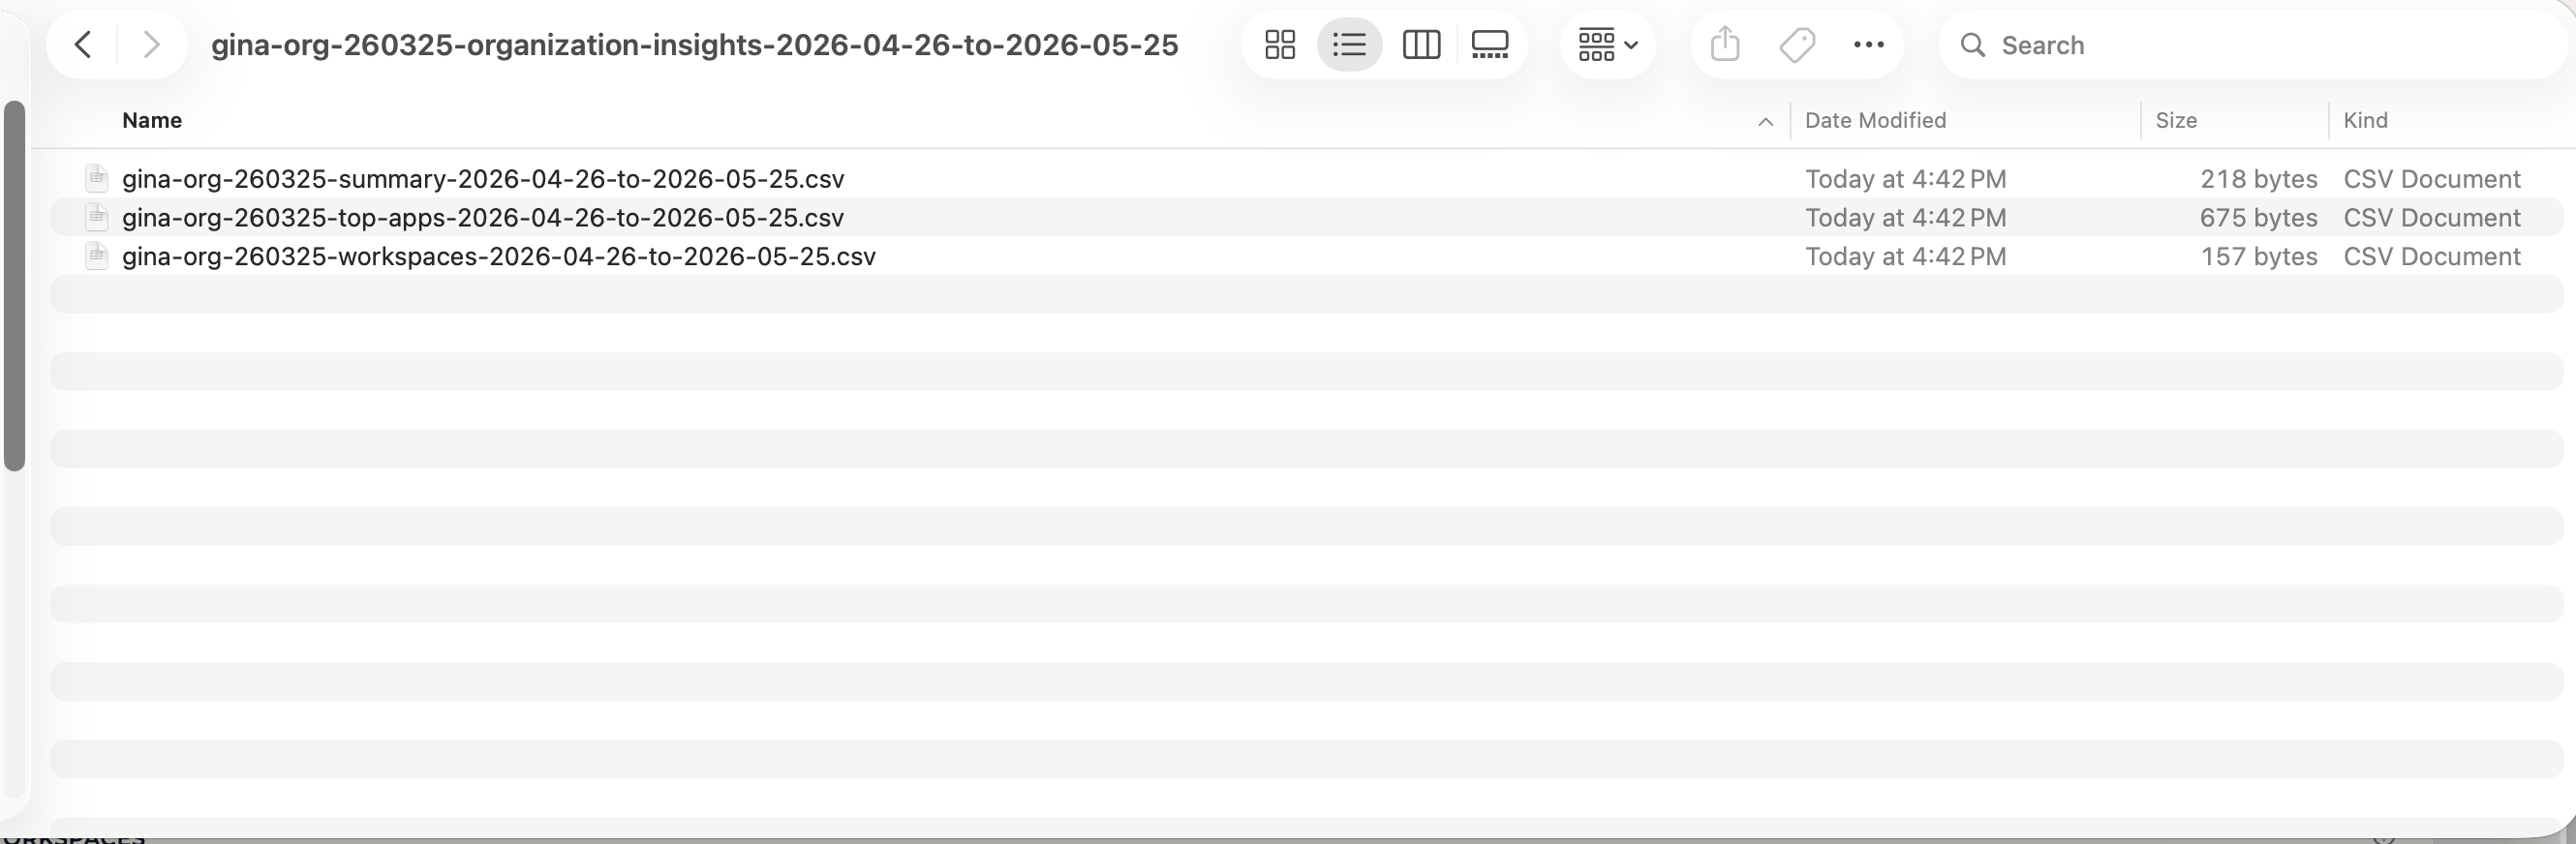
A simple **Metric / Value** table of the org-wide numbers from the summary cards: apps used, total apps, active members, total members, active-member percentage, logged-in and anonymous sessions, and the count of members with three or more flags.
### summary.csv
A simple **Metric / Value** table of the org-wide numbers from the summary cards: apps used, total apps, active members, total members, active-member percentage, logged-in and anonymous sessions, and the count of members with three or more flags.
 ### workspaces.csv
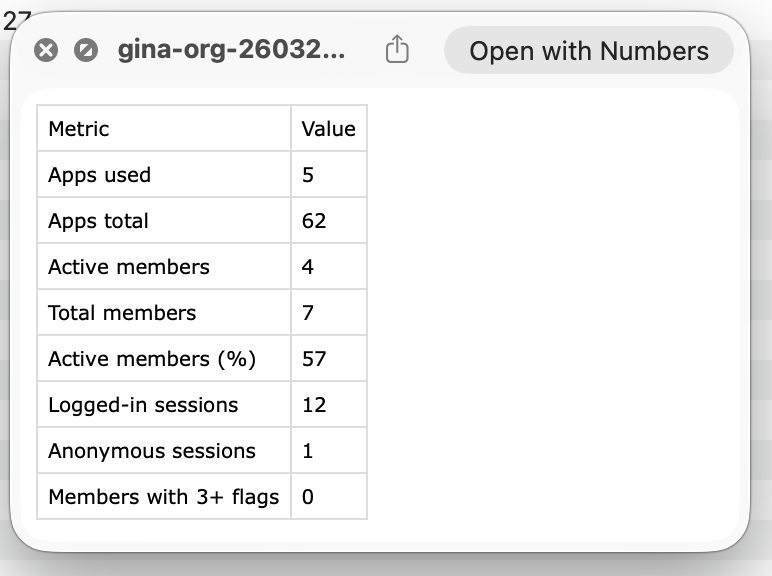
One row per workspace, with **Workspace ID**, **Workspace Name**, **Members**, **Total Sessions**, and **Apps Used** — the data behind the Workspaces table on the page.
### workspaces.csv
One row per workspace, with **Workspace ID**, **Workspace Name**, **Members**, **Total Sessions**, and **Apps Used** — the data behind the Workspaces table on the page.
 ### top-apps.csv
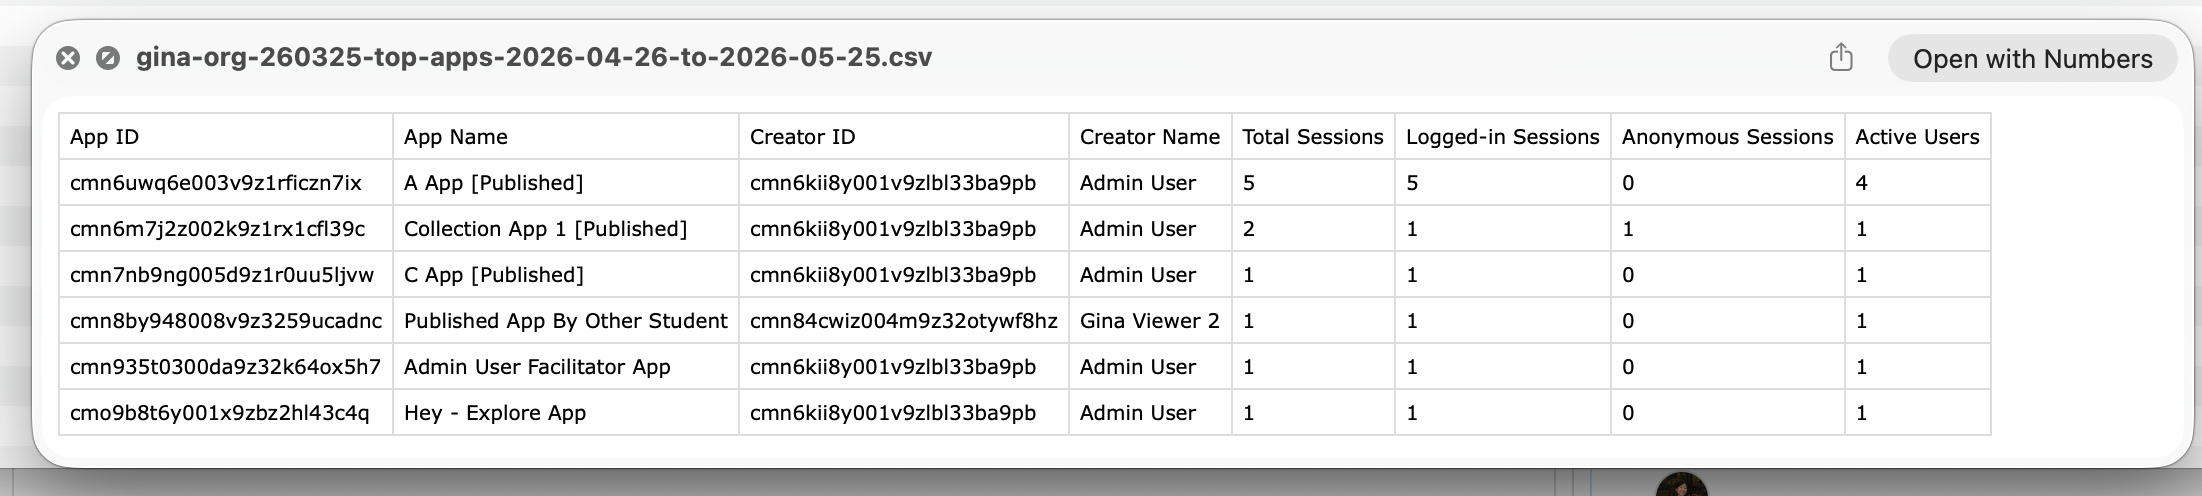
One row per app, with **App ID**, **App Name**, **Creator ID**, **Creator Name**, **Total Sessions**, **Logged-in Sessions**, **Anonymous Sessions**, and **Active Users** — the data behind the Top apps table, including the IDs and creator details that the on-screen table abbreviates.
### top-apps.csv
One row per app, with **App ID**, **App Name**, **Creator ID**, **Creator Name**, **Total Sessions**, **Logged-in Sessions**, **Anonymous Sessions**, and **Active Users** — the data behind the Top apps table, including the IDs and creator details that the on-screen table abbreviates.
 The workspaces and top-apps files are capped at **5,000 rows** each. For organizations larger than that, narrow the date range to keep each export within the limit.
## Key points
* One **Export** button on the Organization Insights page downloads a ZIP of CSVs
* The export reflects the **date range** you have selected (7d, 30d, 90d, or custom)
* The ZIP contains three files: **summary**, **workspaces**, and **top apps**
* Available to **organization Owners** with access to the Insights page
## FAQ
Yes. The CSVs are generated from the same data and the same date range as the page, so the summary numbers line up with the cards and the tables match the Workspaces and Top apps lists.
A ZIP file containing three CSVs (summary, workspaces, top apps). CSV opens in any spreadsheet app — Numbers, Excel, or Google Sheets.
Yes. Set the range with the 7d / 30d / 90d chips or a custom range before clicking Export. The dates are written into the filenames, so exports for different ranges don't collide.
Organization Owners with access to the Insights page. It uses the same permission as the Insights page itself — there's no separate export permission.
The workspaces and top-apps files are capped at 5,000 rows each. If your org is larger, export a narrower date range.
This is the org-wide Insights export (summary, workspaces, top apps as CSVs). The [workspace Activity view](/getstarted/Reviewing%20Activity) exports conversation-level activity as JSON for a single workspace. Use Insights for org-wide trends and the workspace export for detailed session review.
***
Last updated: 06-26-2026
Contact us at [support@playlab.ai](mailto:support@playlab.ai)
The workspaces and top-apps files are capped at **5,000 rows** each. For organizations larger than that, narrow the date range to keep each export within the limit.
## Key points
* One **Export** button on the Organization Insights page downloads a ZIP of CSVs
* The export reflects the **date range** you have selected (7d, 30d, 90d, or custom)
* The ZIP contains three files: **summary**, **workspaces**, and **top apps**
* Available to **organization Owners** with access to the Insights page
## FAQ
Yes. The CSVs are generated from the same data and the same date range as the page, so the summary numbers line up with the cards and the tables match the Workspaces and Top apps lists.
A ZIP file containing three CSVs (summary, workspaces, top apps). CSV opens in any spreadsheet app — Numbers, Excel, or Google Sheets.
Yes. Set the range with the 7d / 30d / 90d chips or a custom range before clicking Export. The dates are written into the filenames, so exports for different ranges don't collide.
Organization Owners with access to the Insights page. It uses the same permission as the Insights page itself — there's no separate export permission.
The workspaces and top-apps files are capped at 5,000 rows each. If your org is larger, export a narrower date range.
This is the org-wide Insights export (summary, workspaces, top apps as CSVs). The [workspace Activity view](/getstarted/Reviewing%20Activity) exports conversation-level activity as JSON for a single workspace. Use Insights for org-wide trends and the workspace export for detailed session review.
***
Last updated: 06-26-2026
Contact us at [support@playlab.ai](mailto:support@playlab.ai)